
Tools: Python, pandas, statsmodels OLS, matplotlib.
Data: HM Land Registry Price Paid Data (~5M London transactions since 1995) merged by postcode with MHCLG EPC energy certificates.
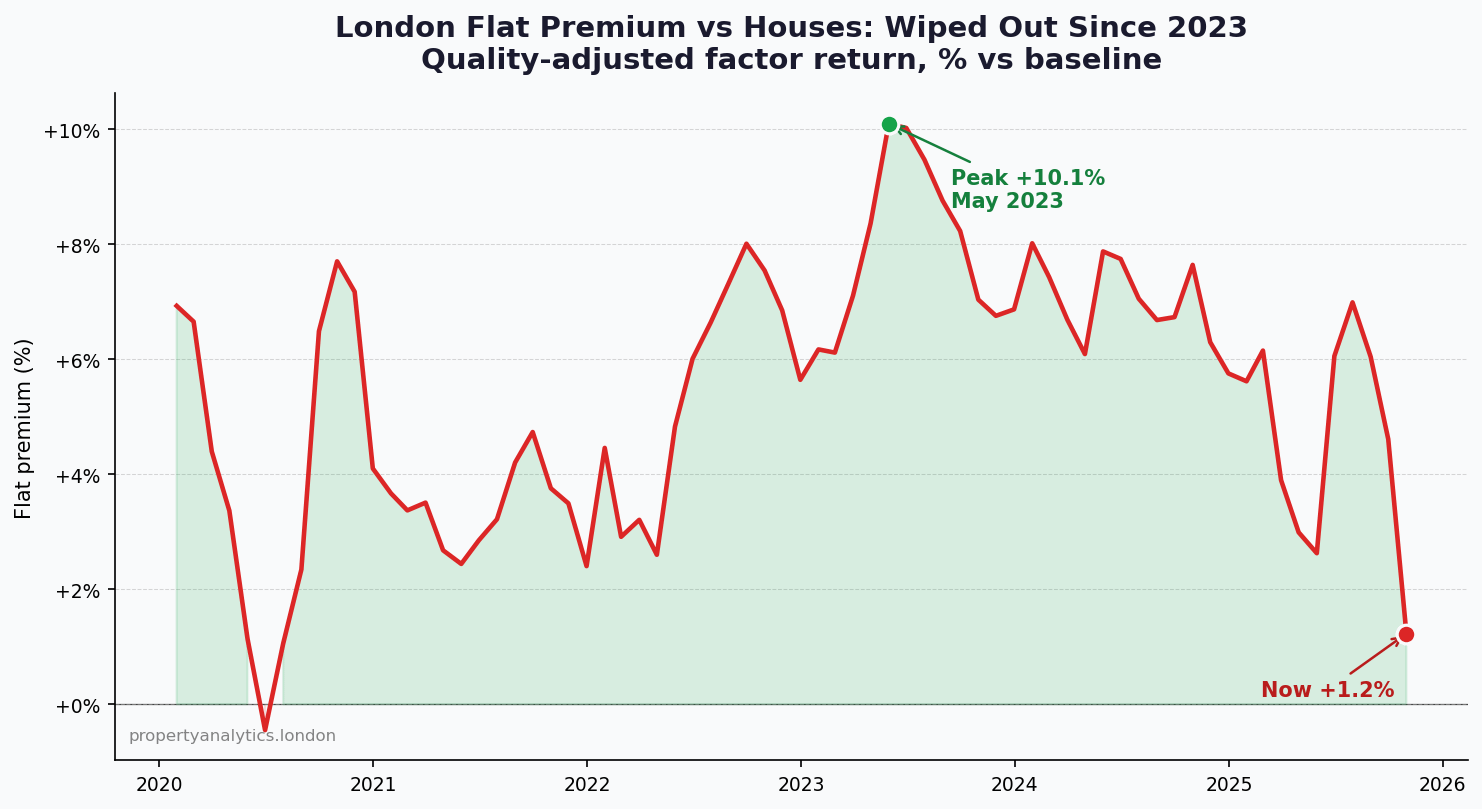
Method: rolling 3-month cross-sectional OLS of log(price/sqm) on hedonic property characteristics (floor area, rooms, EPC band, construction era, flat-vs-house, freehold/leasehold), with postcode-area dummies as controls. The "flat premium" is the coefficient on the flat dummy, how much more per sqm a flat costs vs an otherwise-identical house in the same postcode area.
What it means: in May 2023 a London flat was priced ~10% above an equivalent house per sqm. Today that gap is basically zero. This is the post-rate-rise correction expressing itself compositionally, not as a nominal crash.
Full methodology + interactive charts at propertyanalytics.london.
by Individual_Desk_4046
3 Comments
2 floor house will have less usable space than equal sqm single floor flat because stairs use a lot of space, interesting that the difference disappears, my guess is it’s due to skyrocketing service charges.
Now show the difference between renting and owning per square meter per month in London. Compare all outflow that cannot be recouped later (i.e. don’t count principal part of a mortgage payment.)
Would be interested to see this same plot over say 20 years