Data and graph are from the November 2024 Iran Verification Report. Important event overlay added by me.
by CabSauce

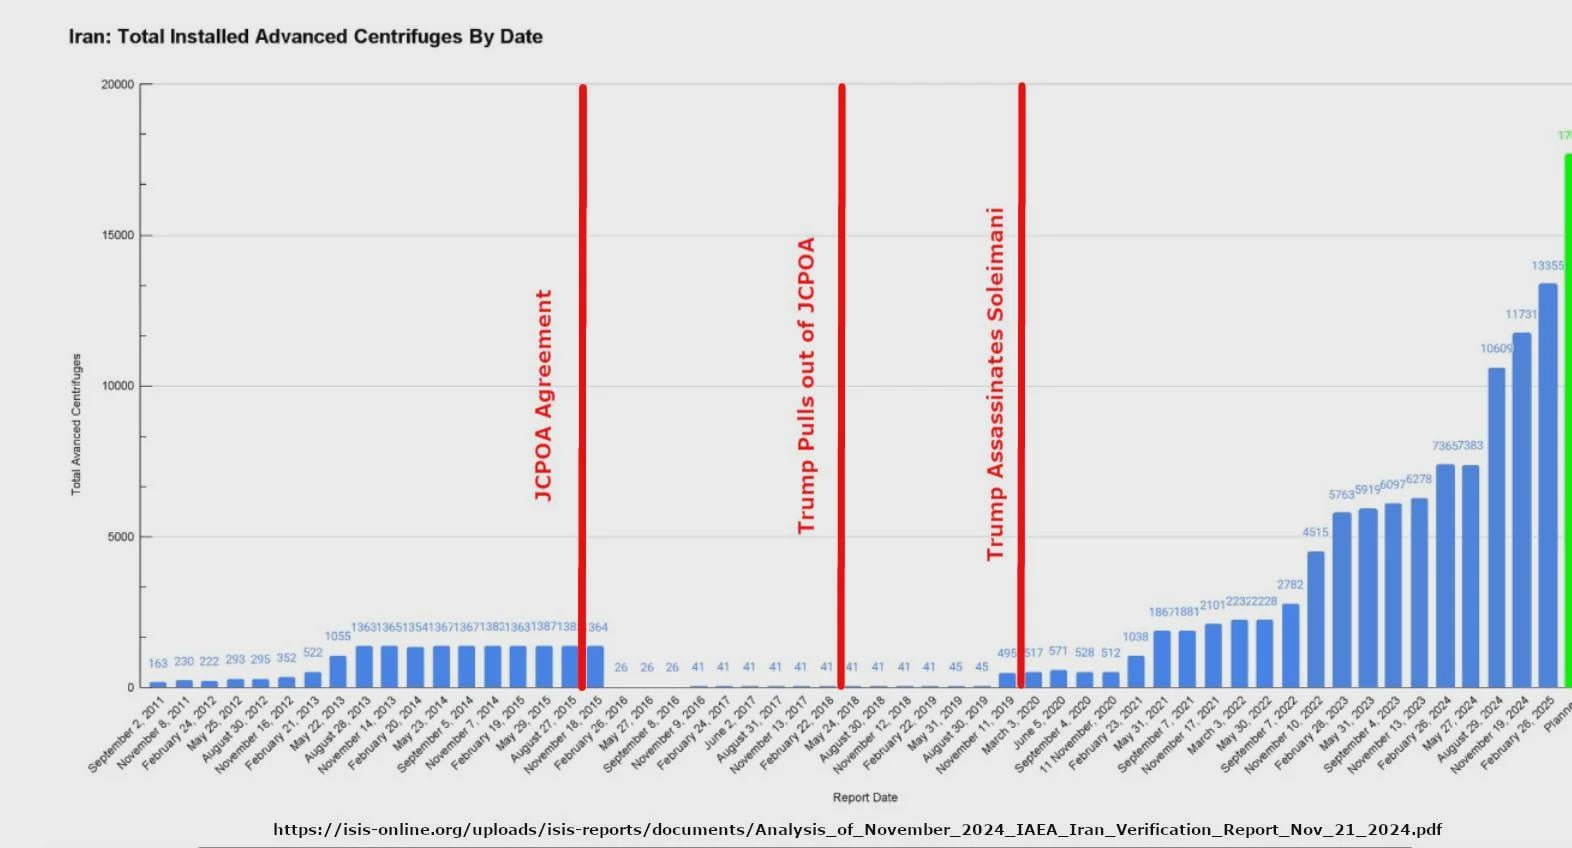
Data and graph are from the November 2024 Iran Verification Report. Important event overlay added by me.
by CabSauce
10 Comments
Should share this far and wide
I’m very surprised news outlets haven’t posted this graph.
It really tells the story of how insanely bad Trump’s strategy has been.
[deleted]
Here’s the link so nobody has to type:
[https://isis-online.org/isis-reports/analysis-of-iaea-iran-verification-and-monitoring-report-november-2024](https://isis-online.org/isis-reports/analysis-of-iaea-iran-verification-and-monitoring-report-november-2024)
Edit: Institute for Science and International Security. Not the other one.
Another proof the US is a rogue state and Trump, a terrorist leader.
Avanced? I totally trust this highly reputable data. /s
Thanks Obama / Why would Biden do this?
To the idiot, and others like him, who wanted to say “haha look production took off under Biden!’ and then realized how stupid it was and deleted his comment,
Yeah, I wonder why? Is it because an administration of the United States wantonly abandoned previous deals at the drop of a hat when switching presidents and lost all trust that it would keep any sort of weapons deal going forward?
“Oh, Biden took power, let’s abandon all plans we made because of Trump’s actions, it’s not like him or the Republicans will ever be in charge again.”
…do you realize how stupid that sounds?
Presumably this is total number of -disclosed- which could differ significantly from what they actually had? Assume all governments lie?
Questions… The report you linked in from 2024, where did you get the data for the graph after that? What types of centrifuge are you quantifing: IR1,2,4,6, or did you just group them all together?