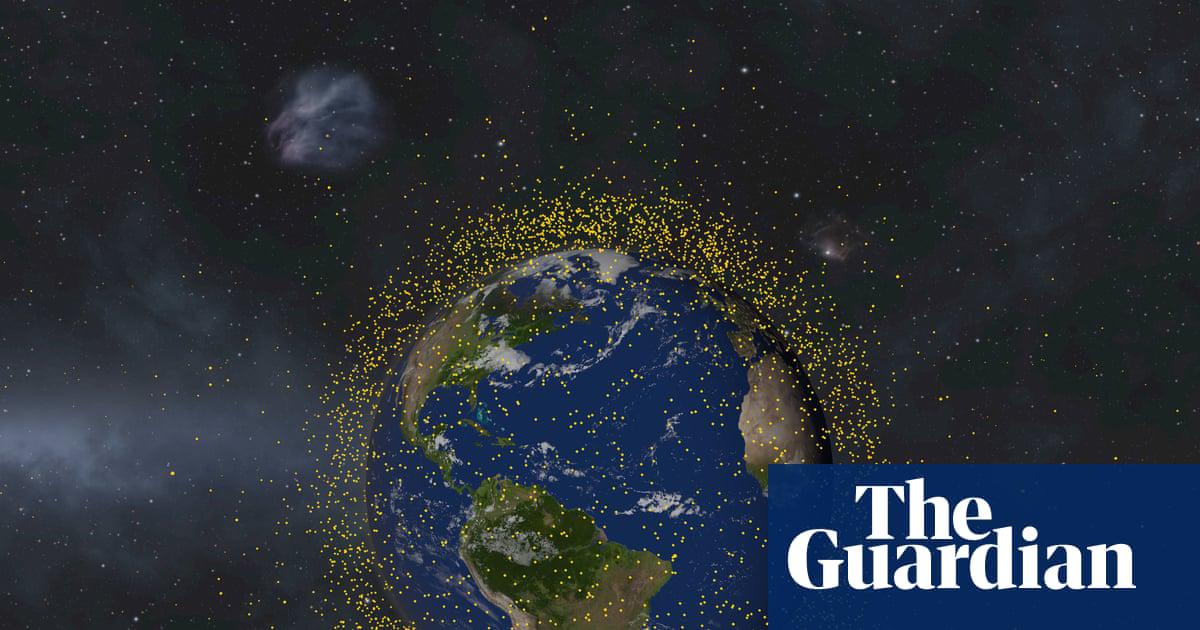
The Guardian has used data from [Space-Track.org](https://www.space-track.org/auth/login), TS Kelso’s [CelesTrak](https://celestrak.org/), and that [collected by the astrophysicist Jonathan McDowell](https://planet4589.org/space/stats/), formerly of the Harvard-Smithsonian Center for Astrophysics, to present as full a picture as possible of the number of satellites orbiting Earth.
[Space-Track.org](http://Space-Track.org) provides data sourced from information gathered by the US Space Surveillance Network (SSN). It does not represent every human-made object in orbit. This is especially the case for satellites with a military application or those that are classified.
The data collected by CelesTrack and McDowell has been used to add to this, to help fill in some gaps based on their research.
The visualisation was built with Canvas.
cyberentomology on
That is not even remotely an accurate visualization, a single pixel representing a satellite is exaggerating that satellite’s scale by one or two orders of magnitude.
perky_python on
Great. Now do it side-by-side with satellites to scale so that this type of animation (which has been done numerous times before) does not continue to perpetuate misunderstanding.
And, yes, I understand you won’t see anything in that second animation. That is the point…to give a better understanding of the true scales involved.
Edit: Zooming on a small patch of sky/orbit might be a better way to do it. Then zoom out.

3 Comments
The Guardian has used data from [Space-Track.org](https://www.space-track.org/auth/login), TS Kelso’s [CelesTrak](https://celestrak.org/), and that [collected by the astrophysicist Jonathan McDowell](https://planet4589.org/space/stats/), formerly of the Harvard-Smithsonian Center for Astrophysics, to present as full a picture as possible of the number of satellites orbiting Earth.
[Space-Track.org](http://Space-Track.org) provides data sourced from information gathered by the US Space Surveillance Network (SSN). It does not represent every human-made object in orbit. This is especially the case for satellites with a military application or those that are classified.
The data collected by CelesTrack and McDowell has been used to add to this, to help fill in some gaps based on their research.
The visualisation was built with Canvas.
That is not even remotely an accurate visualization, a single pixel representing a satellite is exaggerating that satellite’s scale by one or two orders of magnitude.
Great. Now do it side-by-side with satellites to scale so that this type of animation (which has been done numerous times before) does not continue to perpetuate misunderstanding.
And, yes, I understand you won’t see anything in that second animation. That is the point…to give a better understanding of the true scales involved.
Edit: Zooming on a small patch of sky/orbit might be a better way to do it. Then zoom out.