
I made a youtube video related to the optimal Jeopardy! studying strategy: https://youtu.be/v4QzLVYG6bU
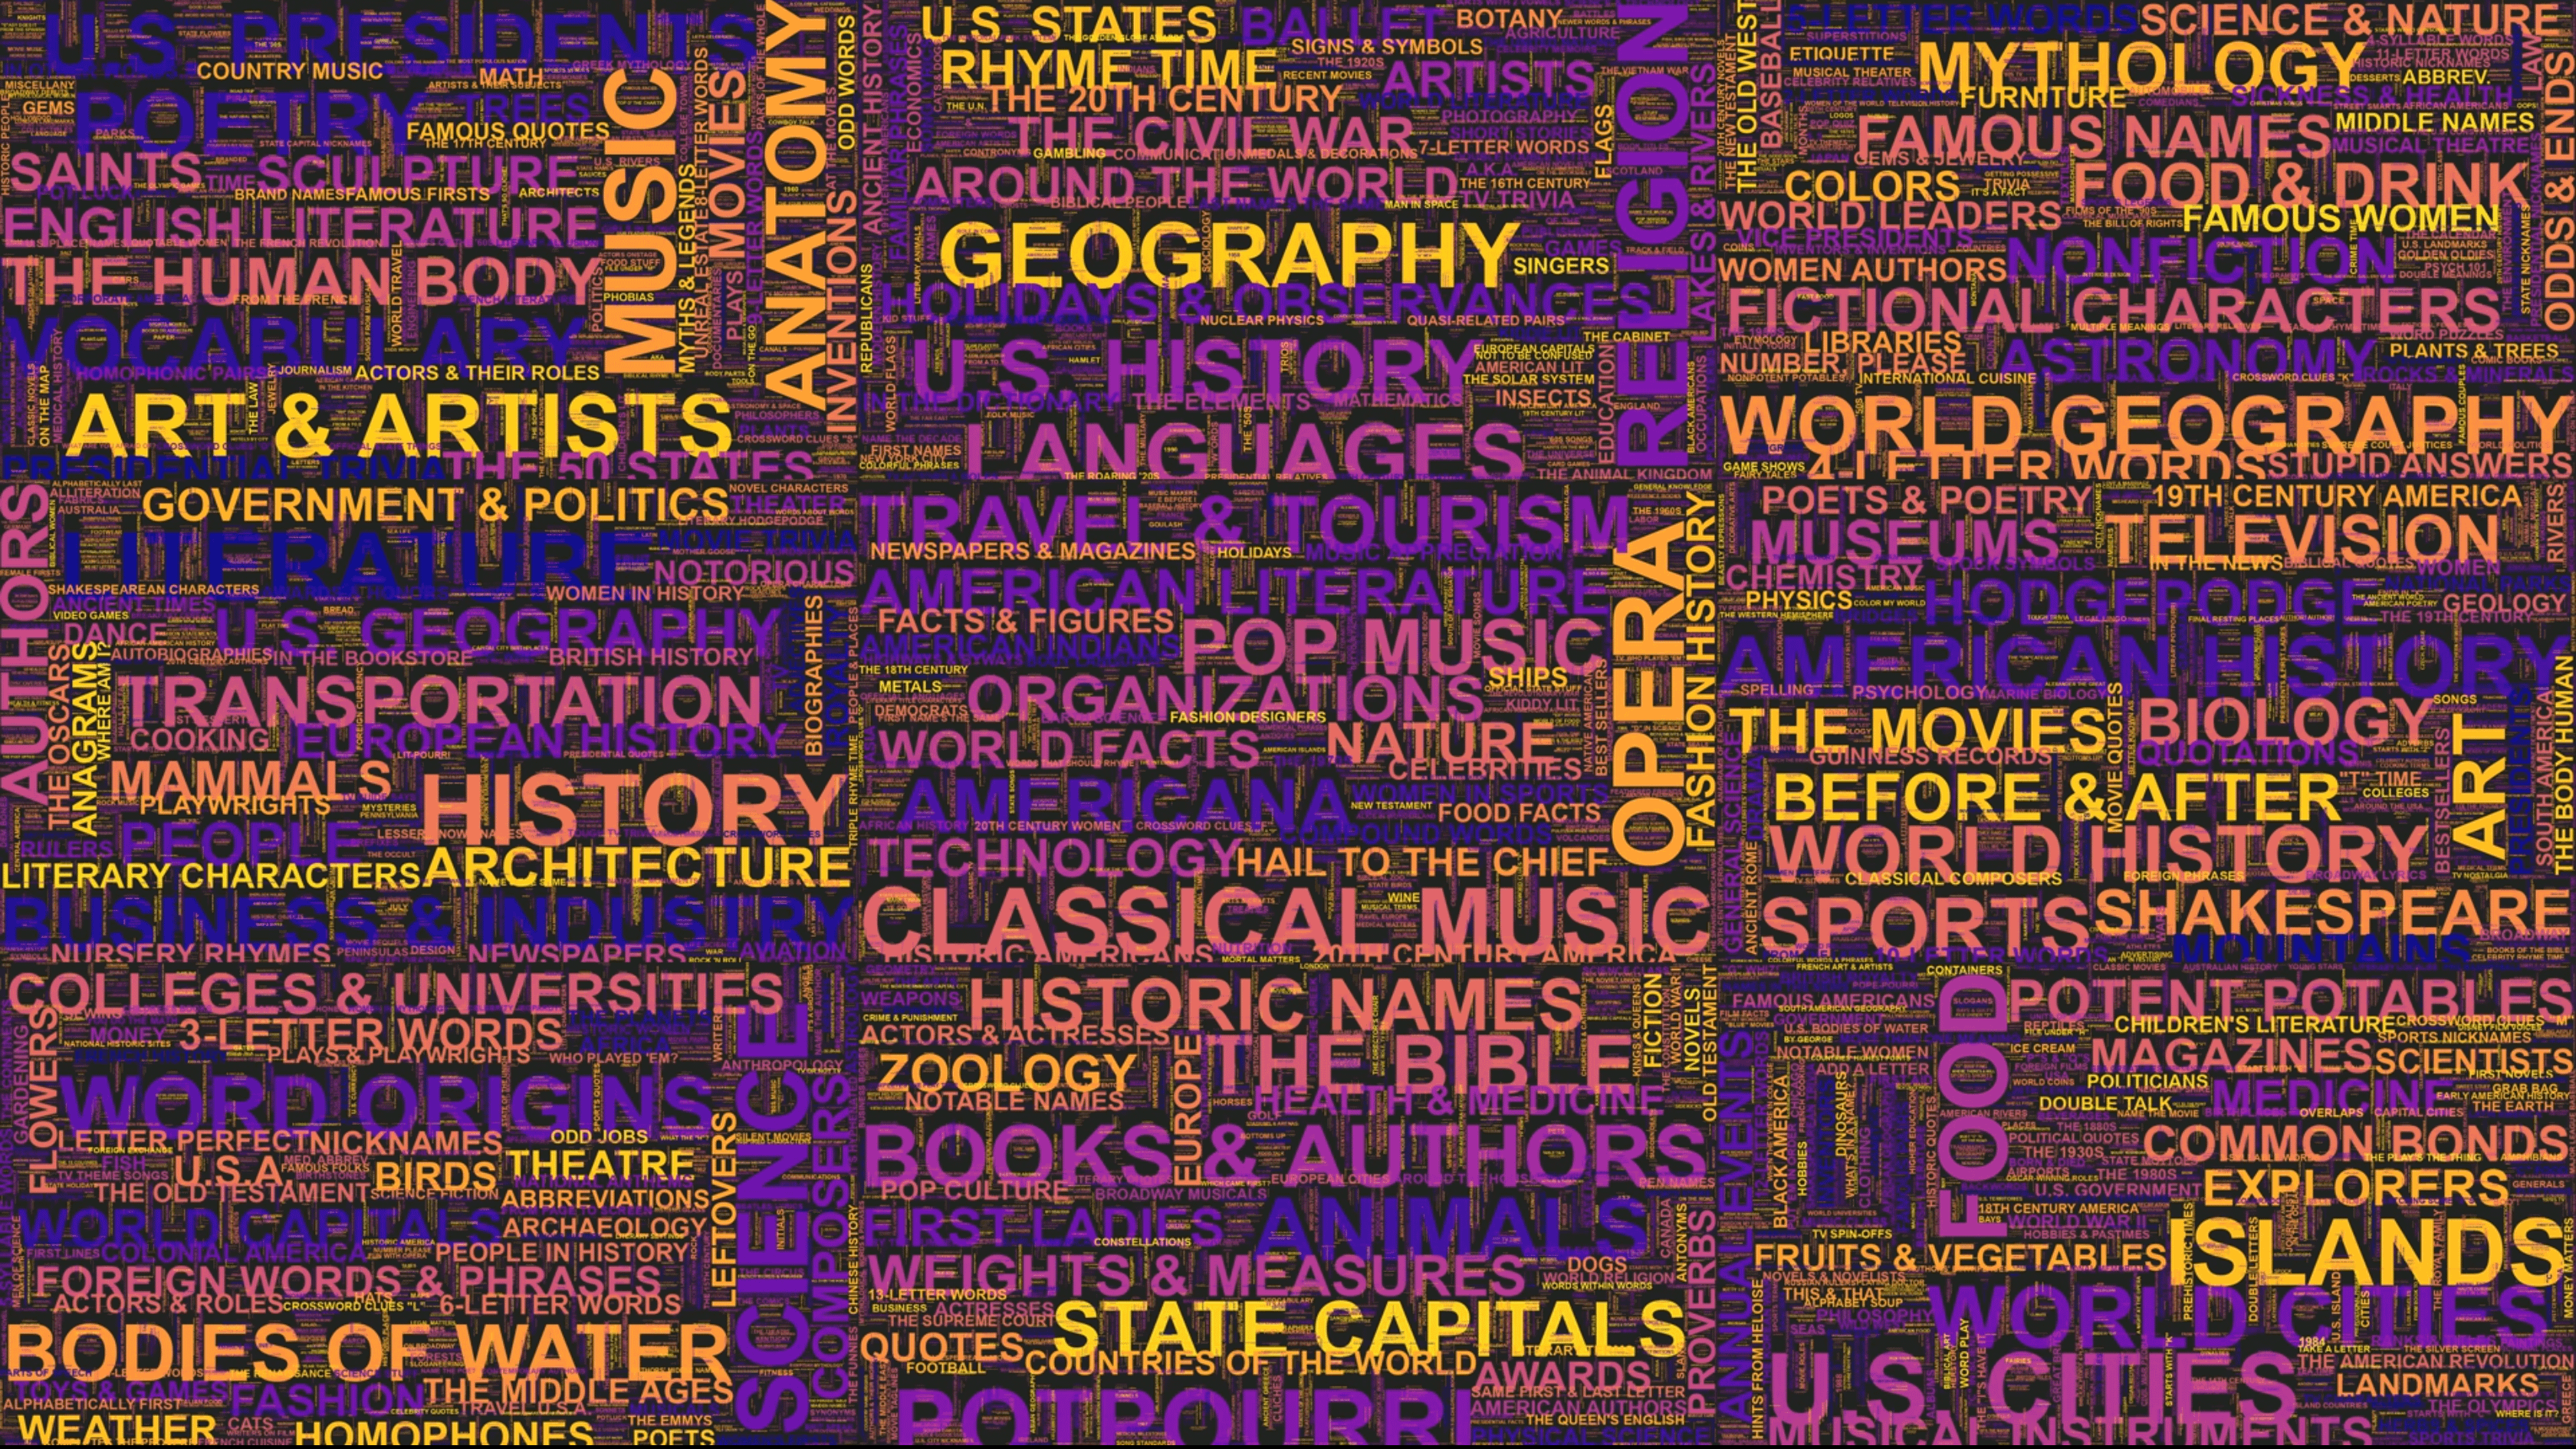
While making it I made a wordcloud of all categories that have ever been given. It's 58000 categories. I needed to stitch together multiple clouds to get them to fit (so it might be a bit closer to dataisugly territory, but I'll give it a shot here). Used square root of frequency rather than linear so even the minor categories get a few pixels.
J-Archive used for the source of data. Manim and wordcloud python library to generate the animated word cloud.
Below are the categories with over 1000 clues, if you fancy a word search.
| Category | Frequency |
|---|---|
| SCIENCE | 1641 |
| HISTORY | 1532 |
| LITERATURE | 1456 |
| AMERICAN HISTORY | 1453 |
| POTPOURRI | 1393 |
| SPORTS | 1326 |
| WORLD GEOGRAPHY | 1249 |
| BUSINESS & INDUSTRY | 1226 |
| WORLD HISTORY | 1209 |
| WORD ORIGINS | 1189 |
| RELIGION | 1181 |
| TRANSPORTATION | 1080 |
| ANIMALS | 1053 |
| BOOKS & AUTHORS | 1020 |
by dser89
4 Comments
This can’t be correct. I don’t see “S”words or Therapists anywhere.
“I’ll take ‘Le Tits Now’ for $500”
how come ART & ARTISTS looks roughly the same size as HISTORY, and why does OPERA look bigger than both of them?
Can you provide this in a vector format so we can actually read alltbhe words. Maybe something like svg.