Source: Historical price data via IBKR API.
Tools used: Python, Pandas, Matplotlib for visualization.
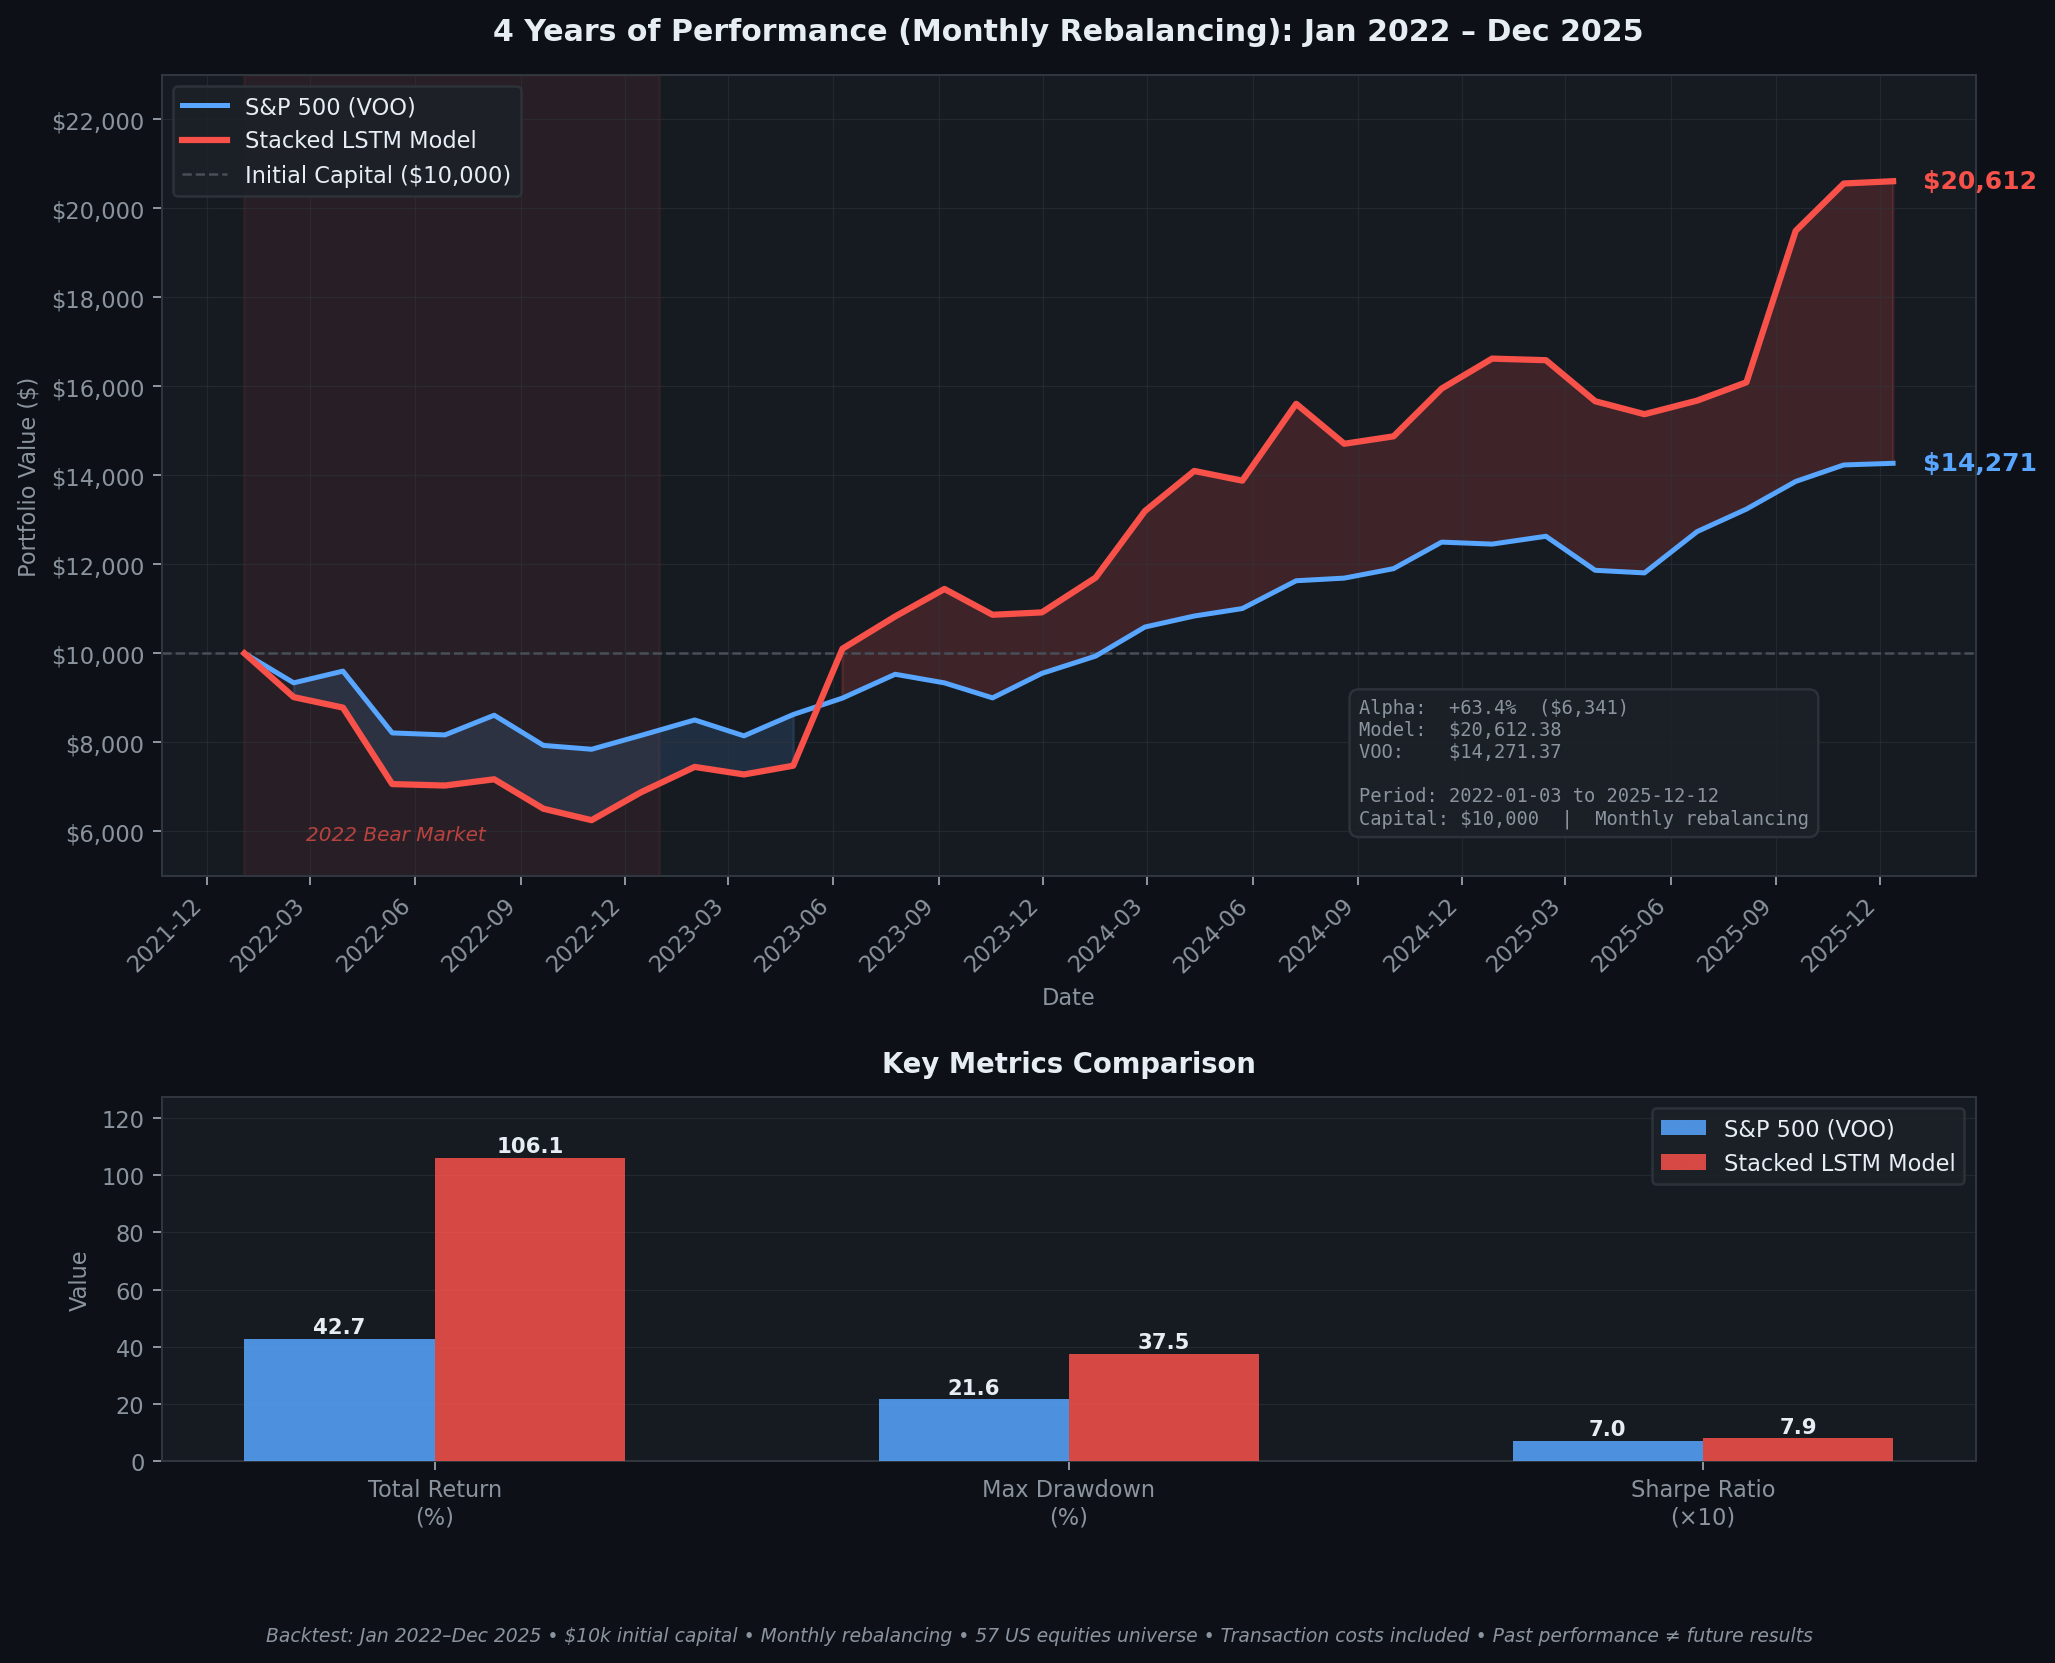
The model is a 2-layer Stacked LSTM trained on 77 large-cap equities, testing an out-of-sample investable universe of 57 stocks with monthly rebalancing. Transaction costs ($1/trade + 0.05% slippage) are included in the equity curve.

1 Comment
Source: Historical price data via IBKR API.
Tools used: Python, Pandas, Matplotlib for visualization.
The model is a 2-layer Stacked LSTM trained on 77 large-cap equities, testing an out-of-sample investable universe of 57 stocks with monthly rebalancing. Transaction costs ($1/trade + 0.05% slippage) are included in the equity curve.