Share Facebook Twitter LinkedIn Pinterest Bluesky Threads [OC] Cultural Moments Increased Phantom of the Opera’s Broadway Attendance by Maclovesdogs2005
Maclovesdogs2005 on March 28, 2026 3:11 am Data was pulled from [CORGIS’ Broadway file](https://corgis-edu.github.io/corgis/csv/broadway/). The visualization was created using Adobe Illustrator.
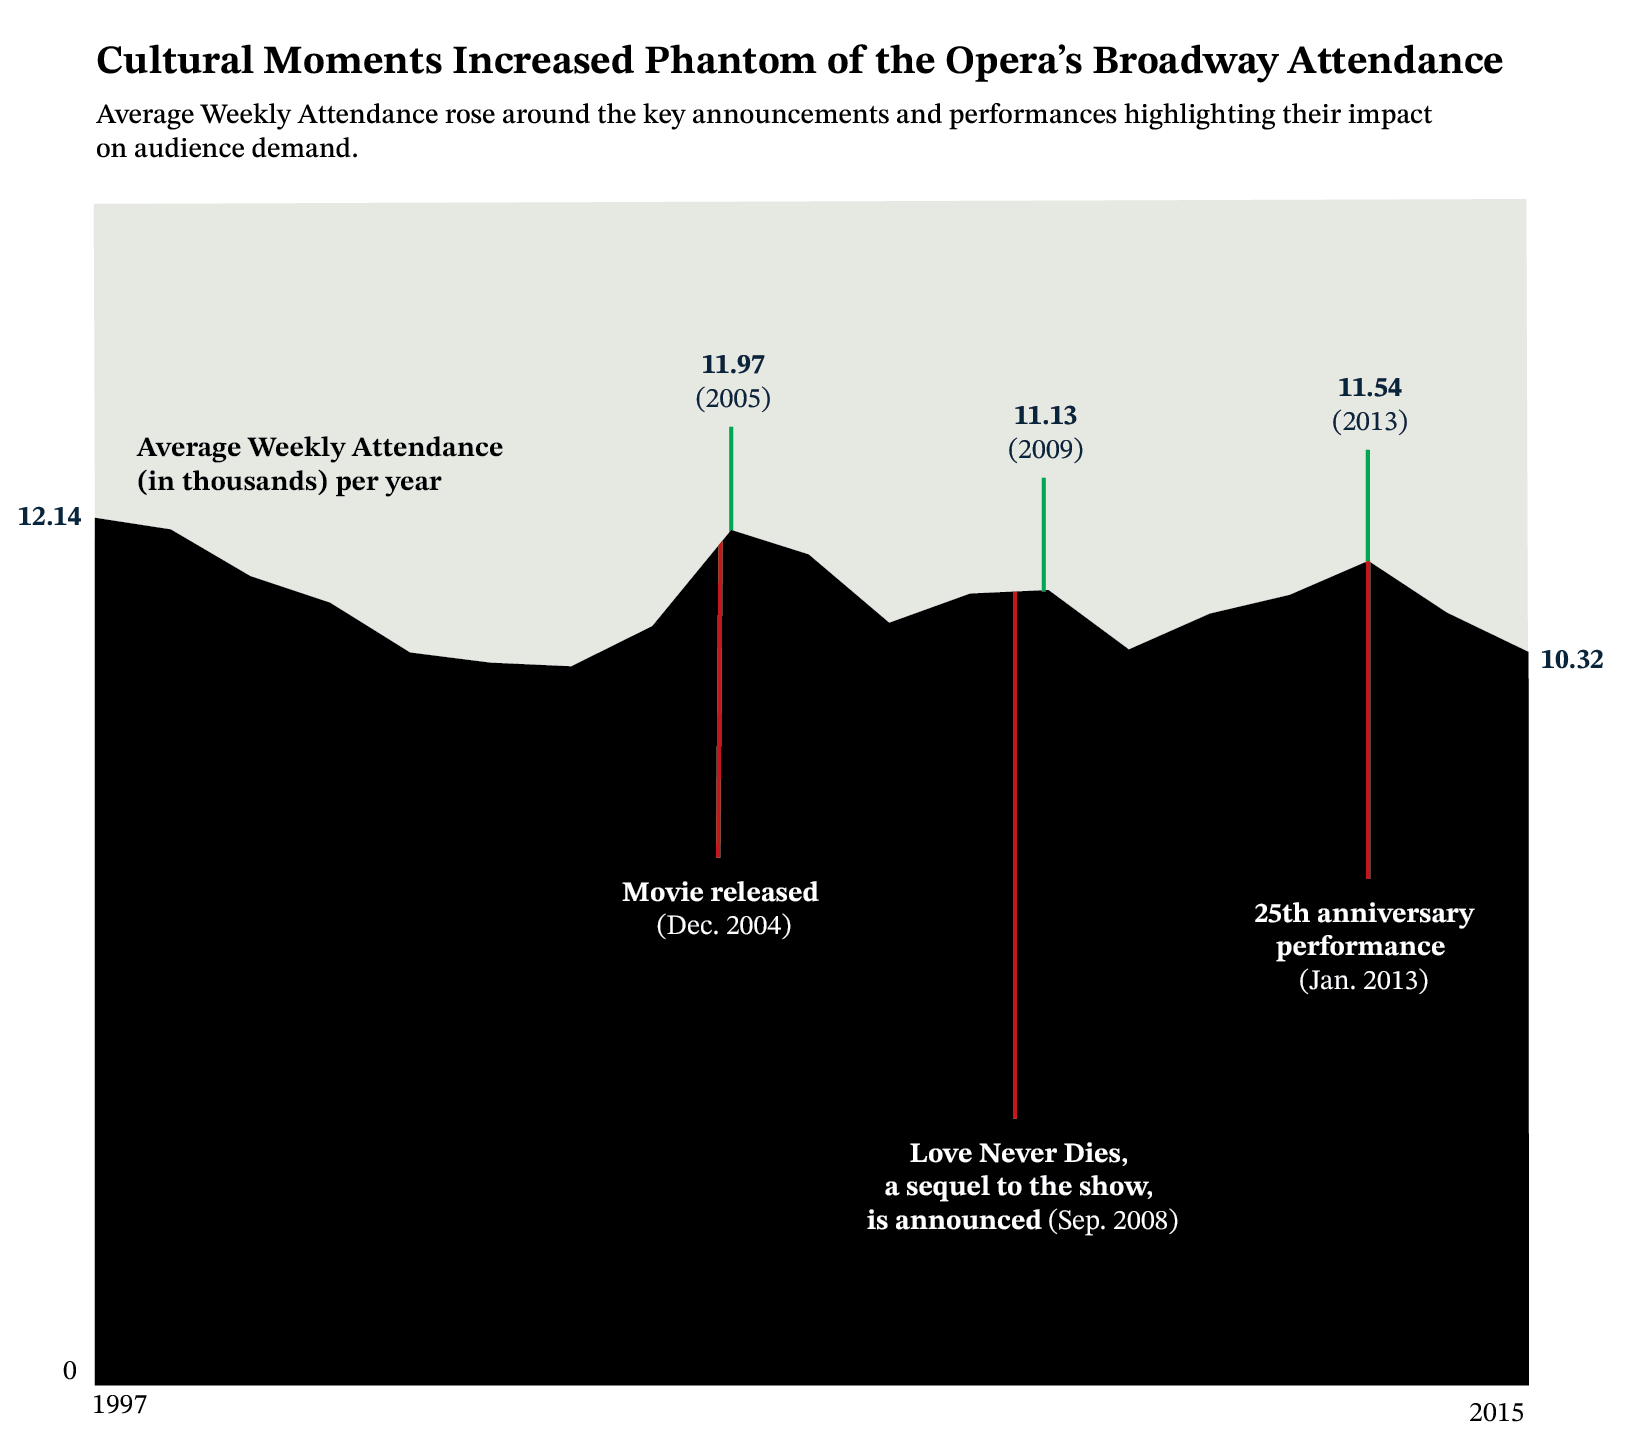
Deto on March 28, 2026 3:14 am It’s crazy just how consistently high it was for nearly 20 years here.

2 Comments
Data was pulled from [CORGIS’ Broadway file](https://corgis-edu.github.io/corgis/csv/broadway/). The visualization was created using Adobe Illustrator.
It’s crazy just how consistently high it was for nearly 20 years here.