Source: Salary data from Levels.fyi, a compensation transparency site. Tax rates sourced from the IRS (federal brackets) and individual state/local tax authorities (2025 rates).
Tools: Python (Matplotlib)
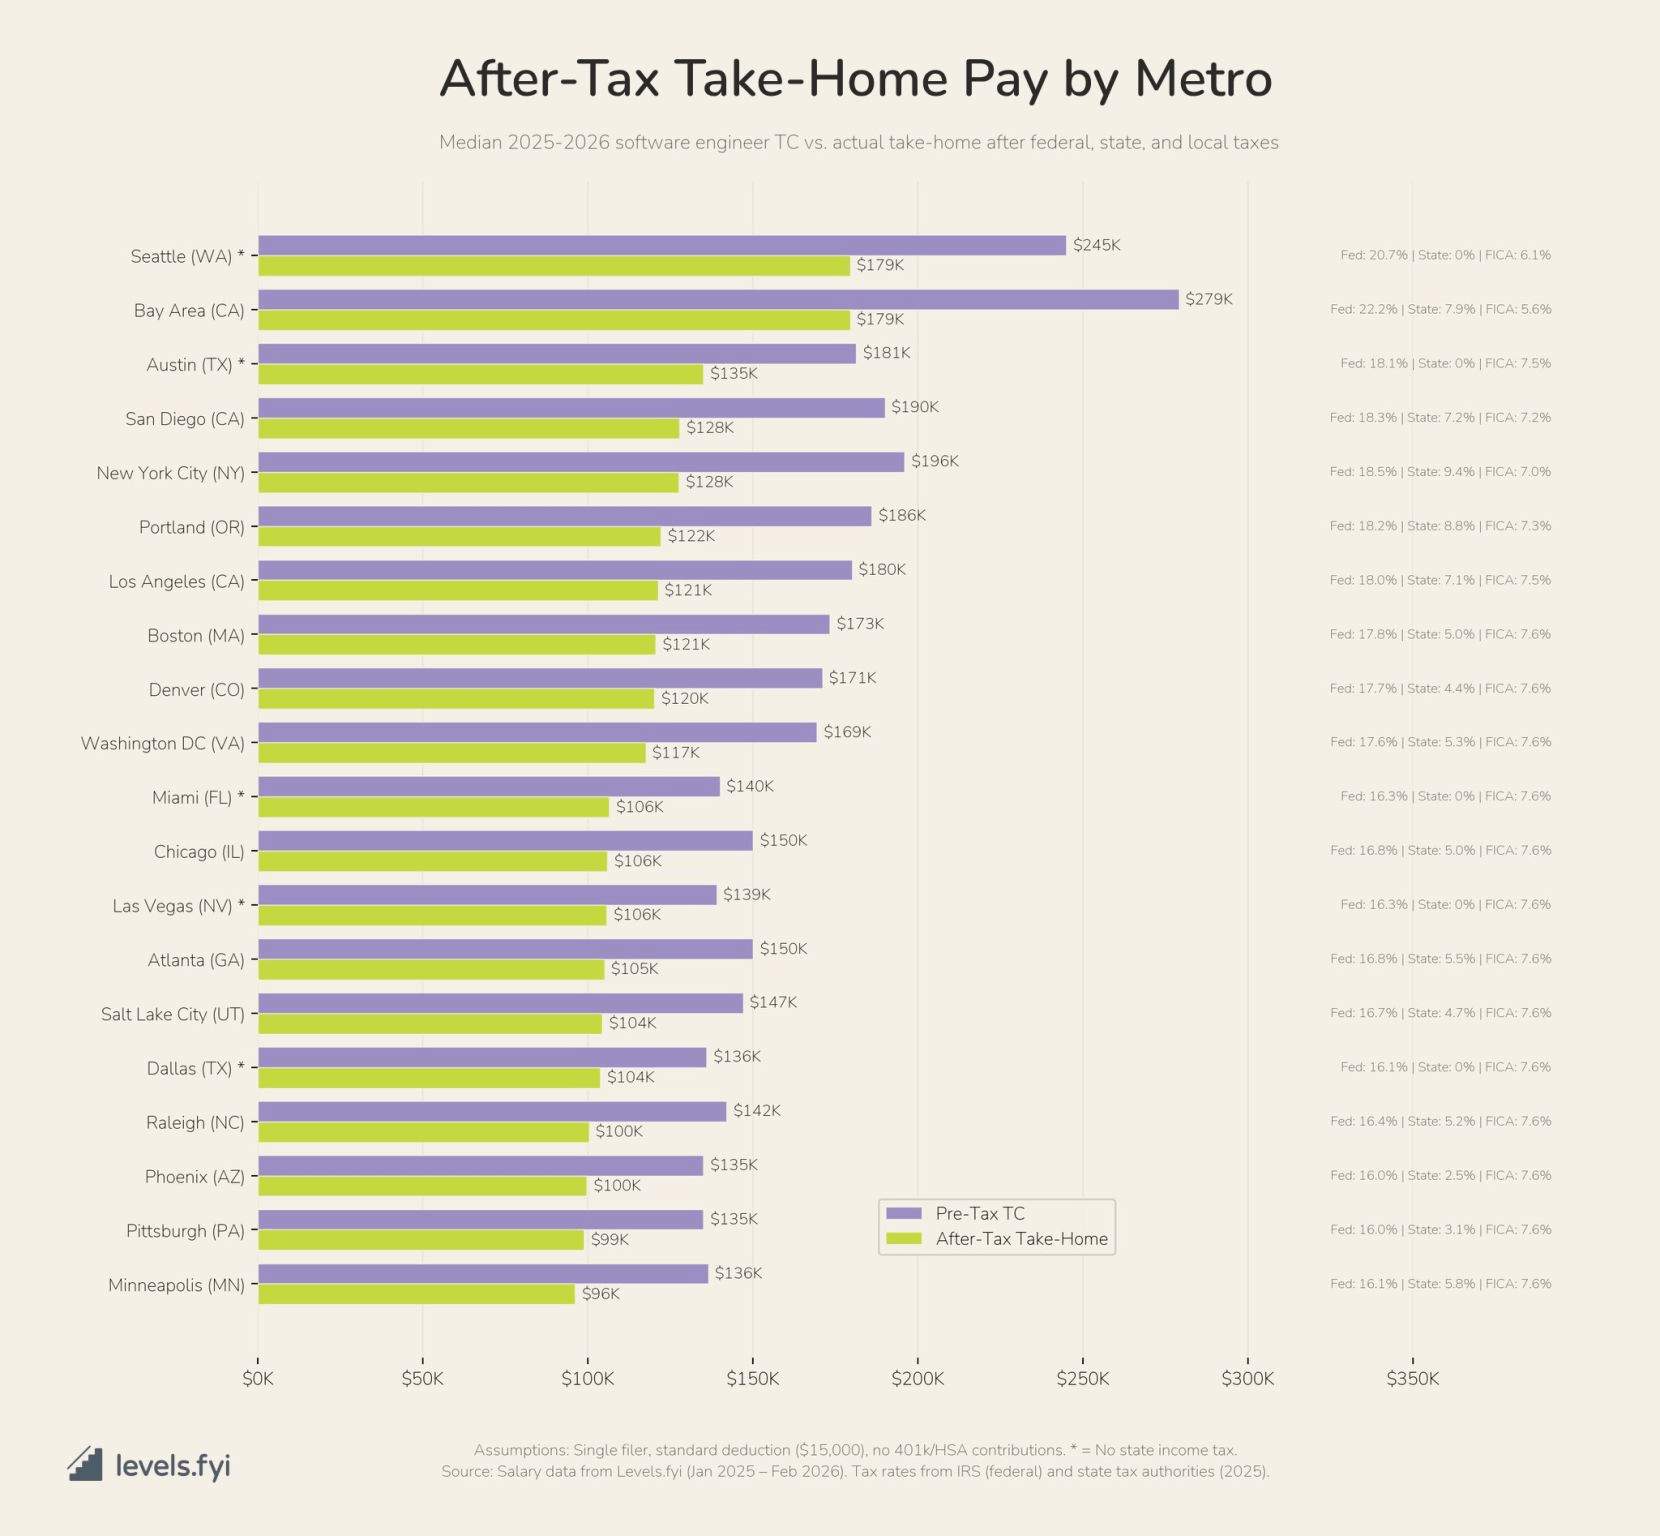
Methodology: For each metro area, I pulled the median total compensation (base + stock + bonus) for software engineers. I then calculated after-tax take-home by applying 2025 federal income tax brackets, state income tax rates, and FICA (Social Security + Medicare) to each metro’s median TC. The breakdown on the right side of the chart shows the effective rate for each component.
Large-Investment-381 on
Very interesting, thank you.
I’d like to have the after-tax percentage (take-home pay) in addition to dollar amounts.
Why is FICA and federal tax percentages different? I would assume they would stay the same b/c we all pay the same? (hopefully, lol)
tmanXX on
Cool info. Seriously!
In this case though, Washington does not have state income tax, so of course they will take home more.

3 Comments
Source: Salary data from Levels.fyi, a compensation transparency site. Tax rates sourced from the IRS (federal brackets) and individual state/local tax authorities (2025 rates).
Tools: Python (Matplotlib)
Methodology: For each metro area, I pulled the median total compensation (base + stock + bonus) for software engineers. I then calculated after-tax take-home by applying 2025 federal income tax brackets, state income tax rates, and FICA (Social Security + Medicare) to each metro’s median TC. The breakdown on the right side of the chart shows the effective rate for each component.
Very interesting, thank you.
I’d like to have the after-tax percentage (take-home pay) in addition to dollar amounts.
Why is FICA and federal tax percentages different? I would assume they would stay the same b/c we all pay the same? (hopefully, lol)
Cool info. Seriously!
In this case though, Washington does not have state income tax, so of course they will take home more.