
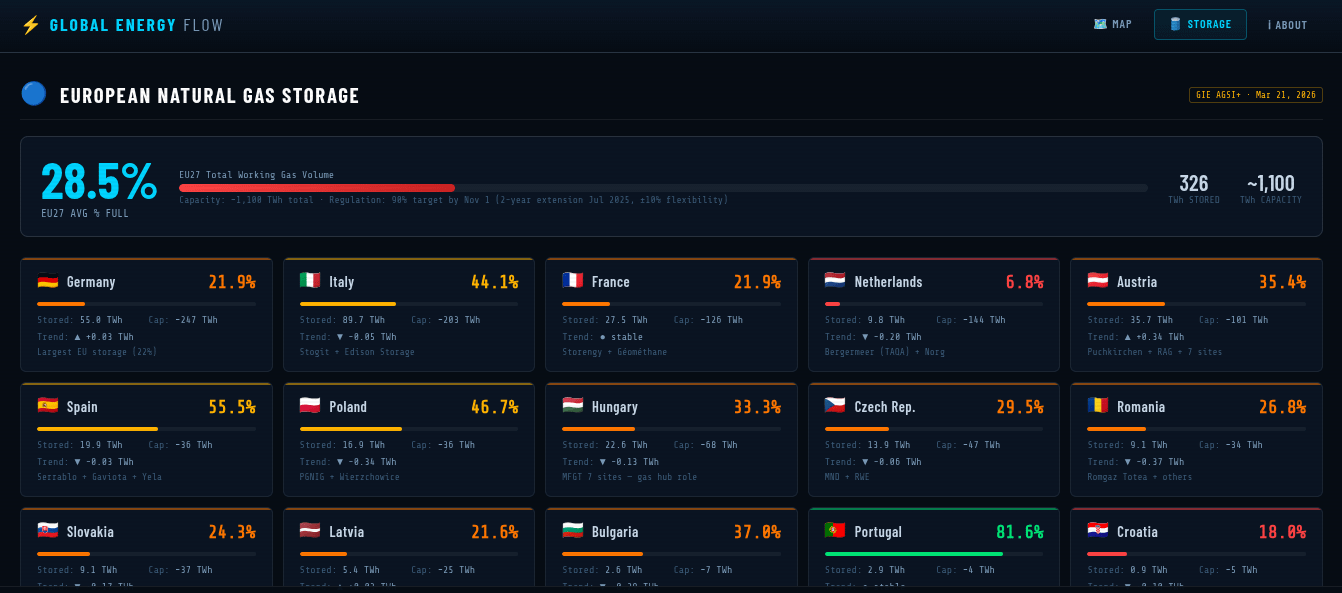
Global Energy Storage Monitor – Live dashboard showing current oil and natural gas storage levels across major regions and strategic reserves.
Key sections include:
– European natural gas storage (% full + TWh, with the official 90% winter target)
– US commercial crude oil and natural gas stocks (EIA weekly)
– Strategic Petroleum Reserves (US, China, Japan, Germany, India and others)
– Major storage hubs worldwide
Data Sources:
LNG terminals & oil fields – IEA, Global Energy Monitor, EIA
European gas – GIE AGSI+
US data – EIA Weekly
Strategic reserves – IEA, DOE & national agencies
Built with D3.js + public data from EIA, IEA, Global Energy Monitor.
All data pulls automatically and refreshes on its own schedule. Clean, no-nonsense design focused on actual energy security and price signals.
What storage trend are you watching most closely right now?
(Full interactive version available in the comments)
by SashSail
6 Comments
Full interactive dashboard here:
https://global-energy-flow.pages.dev/storage
Companion Global Pipeline Map:
https://global-energy-flow.pages.dev/
This is actually very cool!
Good job
Imagine The Netherlands, sitting on a gas bubble with a size of 600 Billion (!) cubic meters. However, the extraction area (Groningen) “suffered” a few light earthquakes (<3 Richter-scale). So what do the idiots of the Dutch government decide? Close the wells! Even better, they’re fill them with cement so they cannot be openend again.
Such a wise decission in times like this…. /S
In the mean time the Dutch people are paying absurd high prices for gas as it all has to be imported now.
Mind you, this is not an ROI decission. It’s purely based on a bunch of farmers with cracks in their walls. Give these “poor” guys 10 million Euro’s each and open up the bloody wells!
Amazing work thank you.
It would be interesting to see storage levels compared to average during past years at that time if that data is available – I think for Europe it exists.
Cause in Europe for example the storage is quite low cause we are at the end of the heating season
Great job dude!
I love the display and the animations, they encourage playing with the tool.
Where did you get the data for the Storage metrics? And how often do you get updates for those? I guess you manually need to update each countrie’s storage capacity as new stand alone or hybrid systems are built?
Great job!
I ended up stuck on this for half an hour instead of working. The oil and gas pipeline pages look amazing.