
When oil surges 10%, airlines drop 12% but oilfield services jump 14%. Gold rises? Mining stocks fly but the dollar weakens.
I wanted to see ALL of these connections in one place — so I built CommodityNode.
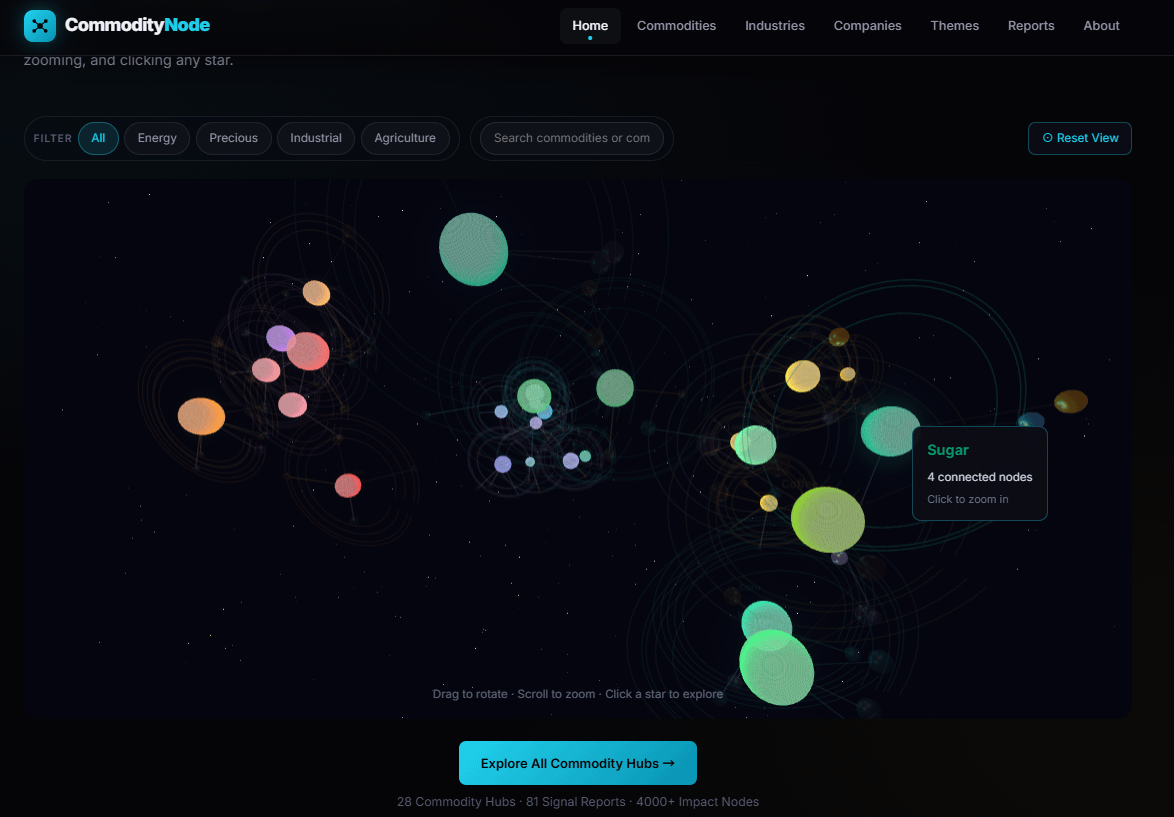
What you're looking at:
• 28 commodities as glowing stars in a 3D universe
• Each star has orbiting nodes showing connected companies, ETFs, and sectors
• Click any star to zoom into its full impact network
• Real correlation data from historical price analysis
Tech stack: Three.js (3D), D3.js (orbital node graphs), Jekyll, GitHub Pages, vanilla JS. No frameworks, no paywall.
81 detailed reports with 50+ node interactive graphs each.
Free to explore: https://commoditynode.com
Data sources: Yahoo Finance, SEC filings, industry reports
Tools: Three.js, D3.js, JavaScript, Jekyll
by CommodityNode