
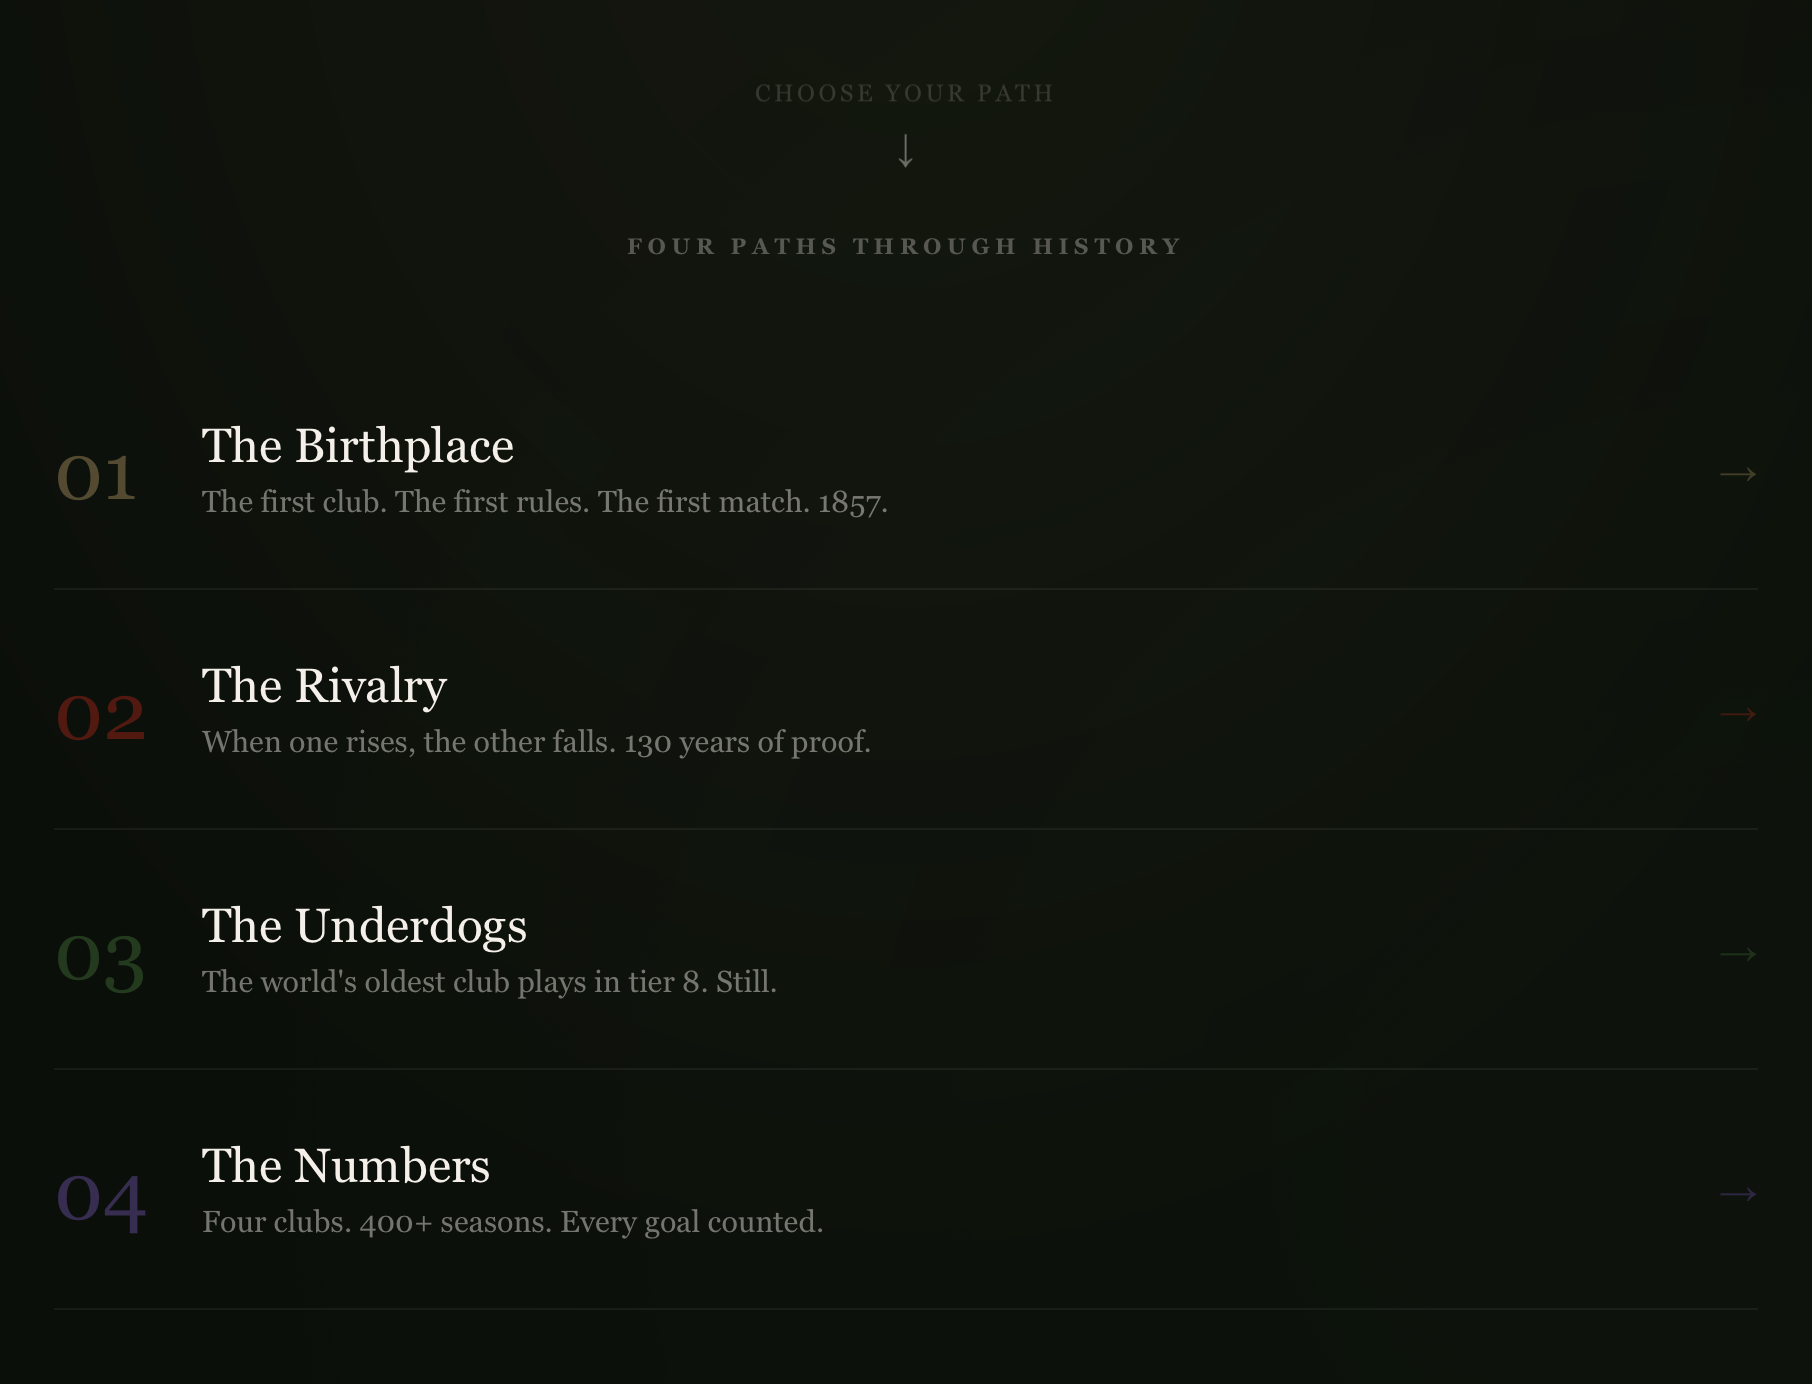
Sheffield, England gave the world organised football — the first club (1857), first rules, first derby, first competition. I built an interactive visualisation exploring this through 4 narrative paths, each with its own animated background and data-driven charts:
Birthplace — The origins: Sheffield FC, Sheffield Rules, and how the city's innovations (corners, headers, crossbars) became the global game
Rivalry — Sheffield United vs Wednesday decade by decade. League positions, head-to-head records, promotions and relegations visualised across 150+ years
Underdogs — The world's two oldest clubs (Sheffield FC and Hallam FC) are still playing today in England's lower leagues, 166 years on
Numbers — Every recorded season: W/D/L, goals, rolling form, best and worst campaigns
Each section has a contextual canvas animation behind it — vintage pitch markings materialising from fog, red and blue ribbons flowing for the derby, rain on a muddy local pitch for the amateur clubs, matrix-style falling stats for the numbers path.
Link: https://sheffield-football.dreamfold.dev
Tools: React, TypeScript, HTML5 Canvas for animated backgrounds, Vite. Data sourced from Wikipedia, official club websites, and historical archives via a pgvector knowledge base with semantic embeddings.
Source: https://github.com/darrylcauldwell/sheffieldFootball
by darryl-c
1 Comment
Sounds like a great project! For interview prep, focus on telling the story of your work. Be ready to explain why you picked these narrative paths and how they show Sheffield’s role in football. Practice making complex data easy to understand for someone who might not know much about football history. It could help to have examples of how similar projects have been used or received by audiences. If you want more structured prep, I’ve found PracHub helpful for mock interviews and feedback. Good luck!