
I'm building a free tool called POLYCRISIS.WORLD (with the help of Claude Code) to better understand connections across active global crises — Iran, Ukraine, Gaza, South China Sea, climate, US domestic, etc. Events are pulled from RSS (AP, Reuters, etc), GDELT, social media, and various APIs every 15 min, categorized, geomapped and organized on a series of maps, graphs and semantic plots.
The point isn't just seeing dots on the map — it's in understanding how events across regions are part of the same cascading system.
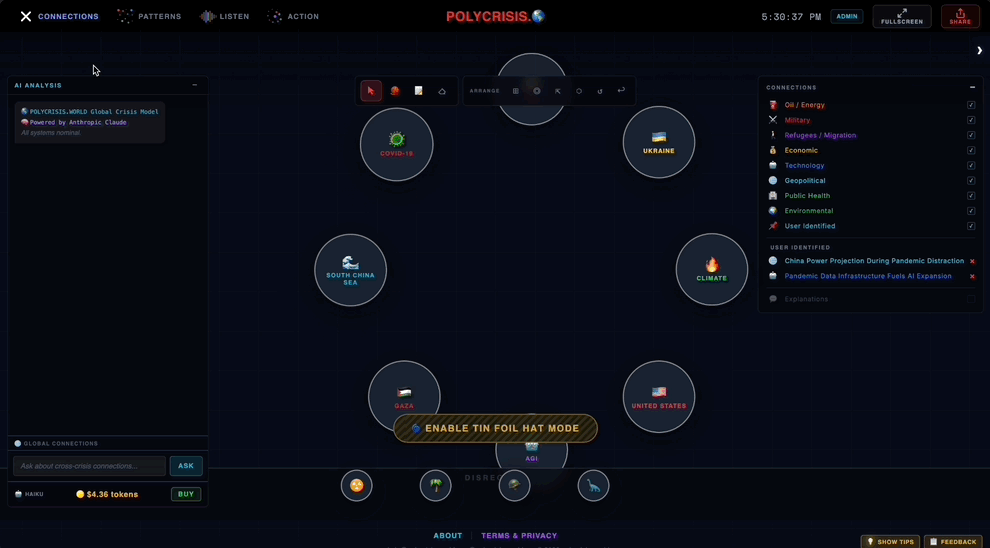
To ensure I'm fully complying with this subreddit's rules (which I can now recite with my eyes closed), the screens shown in the image above are directly linked to here: polycrisis.world?view=connections and polycrisis.world?view=patterns
This is a fully free tool. Create an account to monitor all crises.
by VeterinarianSeal
2 Comments
You built an ai version of Dr Jiang
Interestingly, I was working on a project somewhat similar pulling in RSS, GDELT, Bigquery. I think GDELT is a underutilized resource. Anyhow, I have a very similar poller that the user can configure topics (via key words) and the the articles are pulled in, scraped and entities etc are extracted and put into a vector db for semantic search as either story clusters or articles directly.
Happy to share or compare notes (just pm me), I was creating it to put on github as something organizations could deploy and track information on topics they are interested in.