
Every week I go through pricing data across 47+ US fashion brands. Not what they say prices are, what they actually are based on 30 days of daily tracking.
Here's what this week looks like:
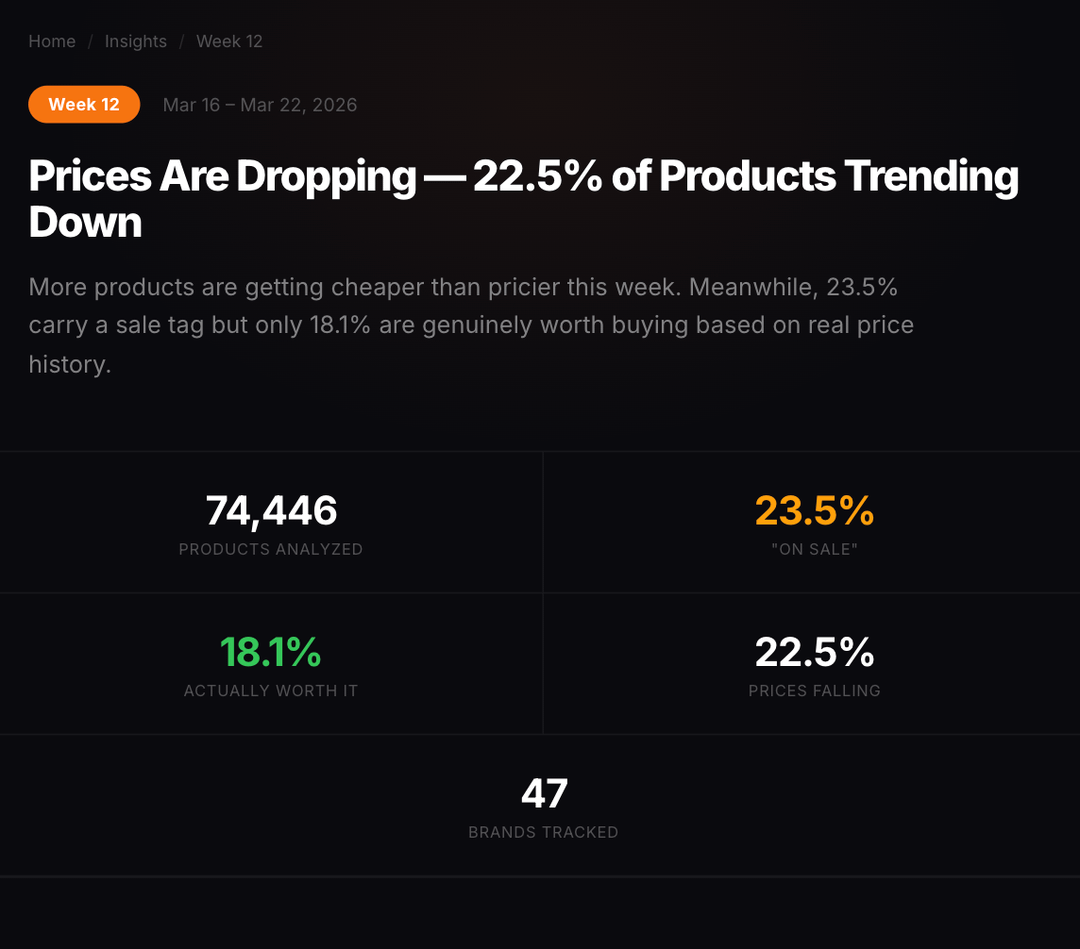
**This week's numbers**
– Products tracked: 74,446
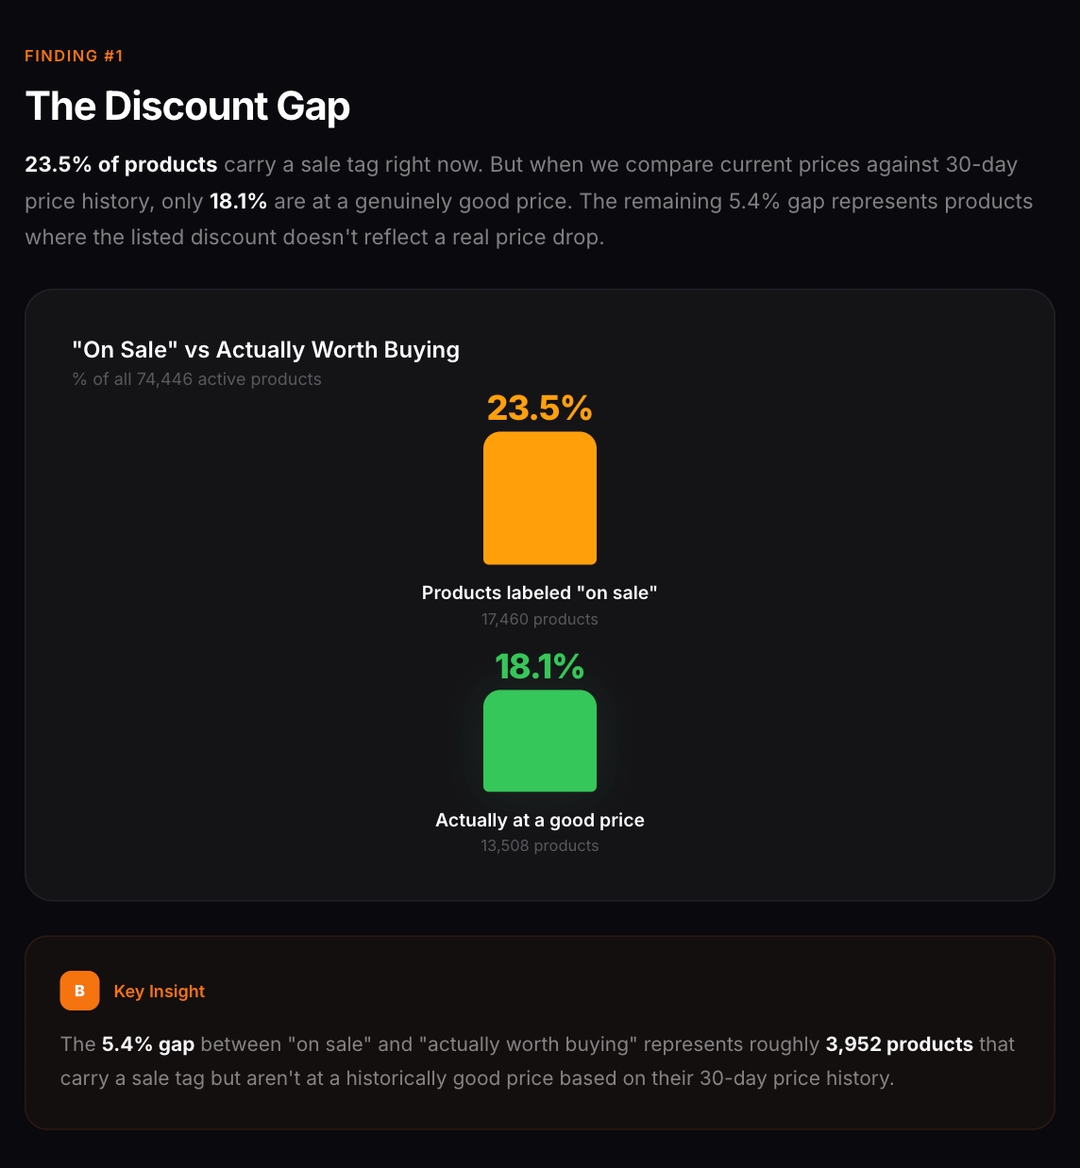
– Products with a "sale" tag: 23.5% (17,460 items)
– Actually at a good price based on 30-day history: 18.1%
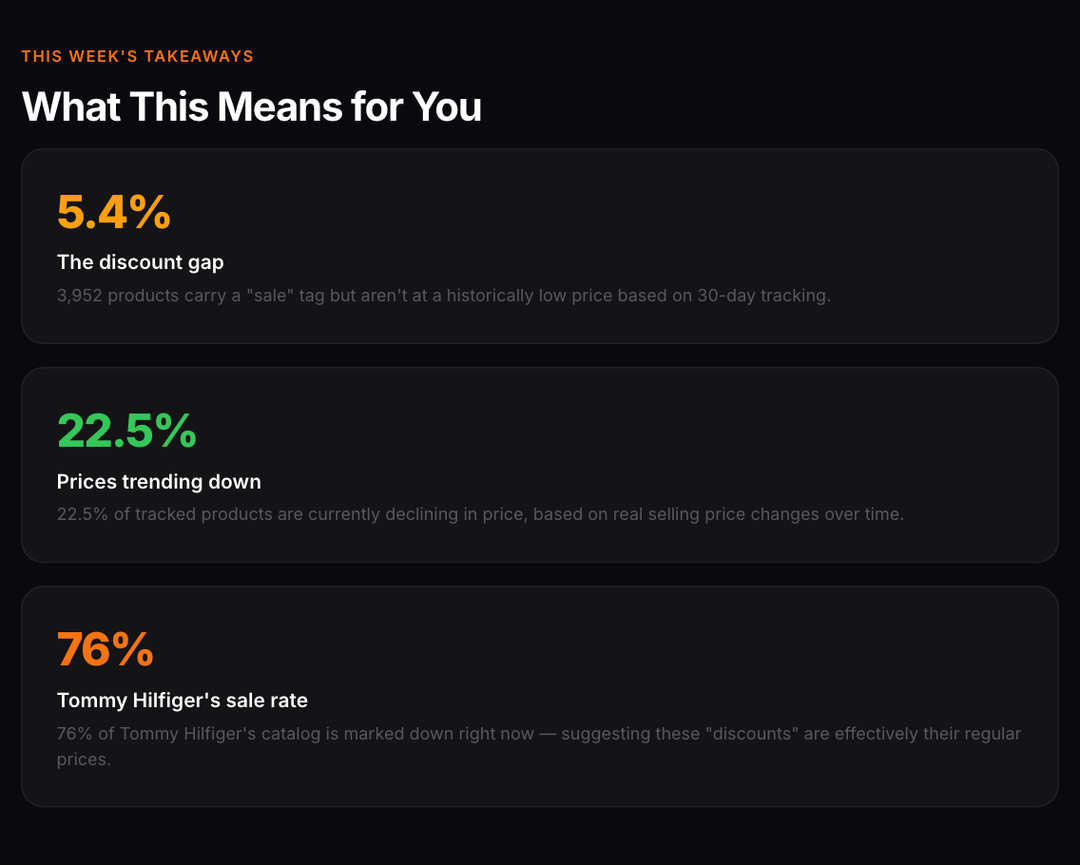
– The gap: 5.4% of "sales" aren't real price drops
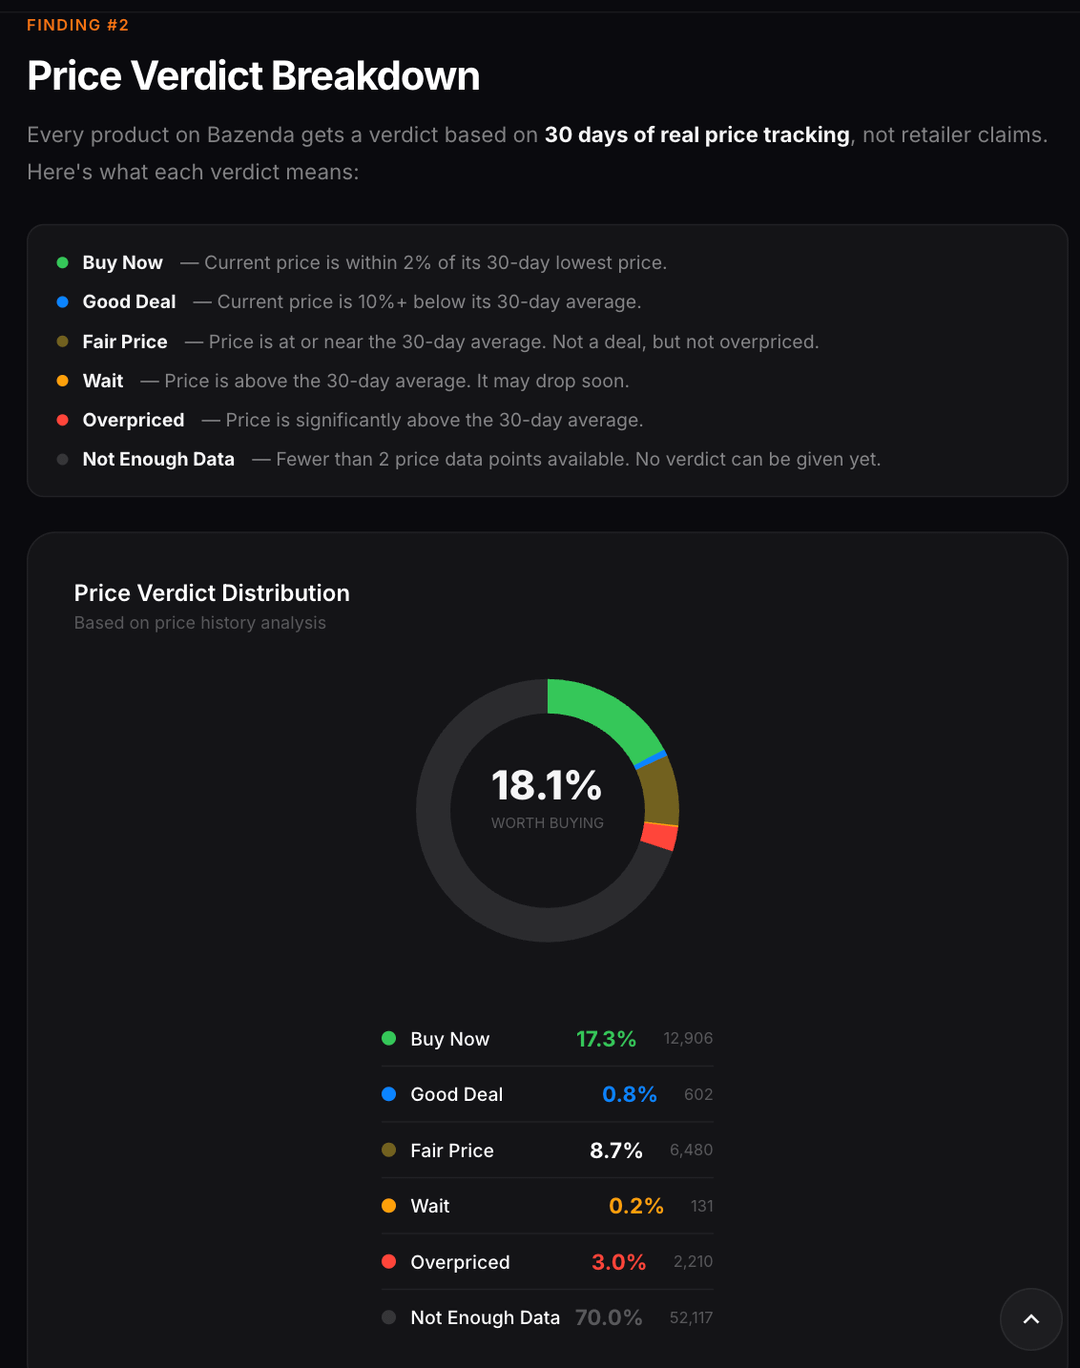
**What the price history says**
– 17.3% are at their lowest price in 30 days (legit deals)
– 0.8% are noticeably below their 30-day average
– 0.2% are above average right now, you'd save money by waiting
– 3.0% are way above their recent average
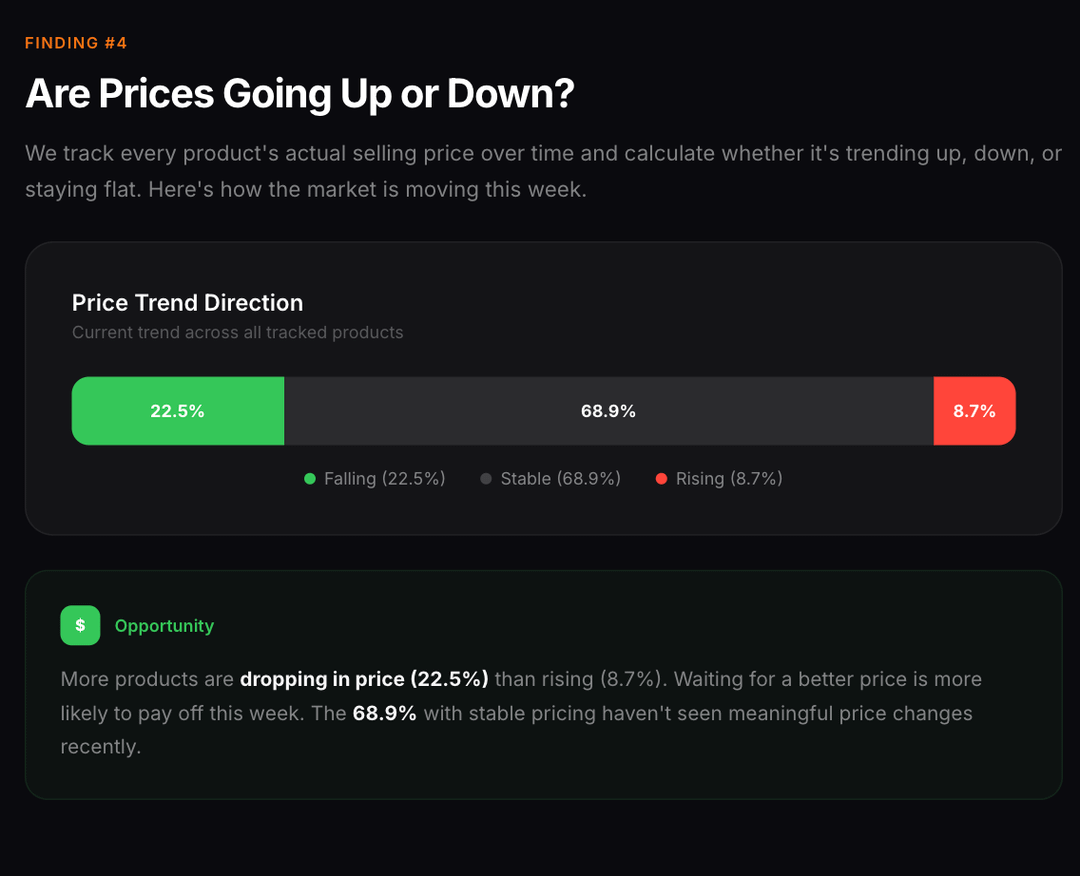
**Price movement**
– 22.5% of products are getting cheaper
– 8.7% are getting more expensive
– 68.9% haven't really moved
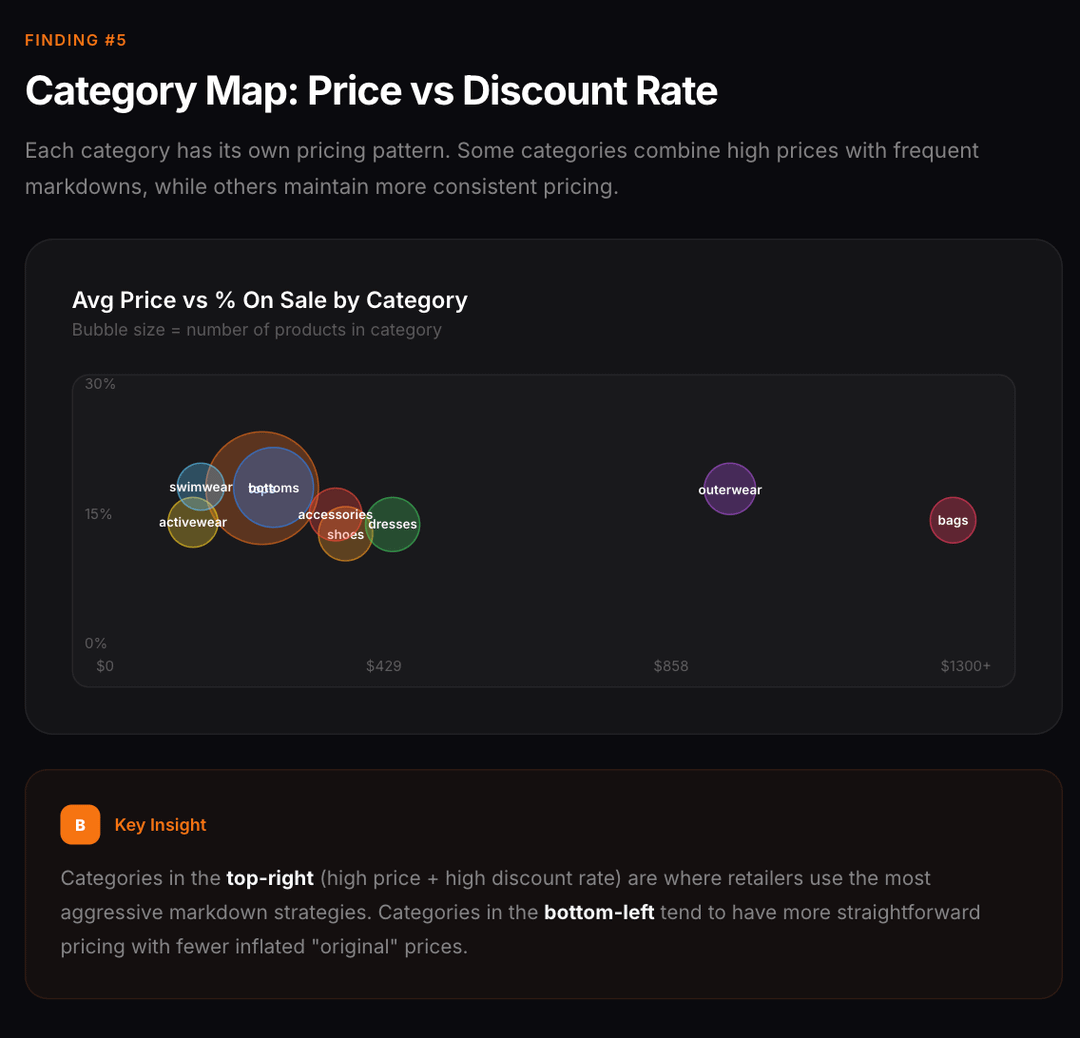
**By category**
| Category | Avg Price | "On Sale" % | Products |
|---|---|---|---|
| tops | $140 | 27% | 27,199 |
| bottoms | $174 | 25% | 14,884 |
| shoes | $315 | 18% | 5,412 |
| dresses | $384 | 19% | 5,216 |
| accessories | $291 | 20% | 4,760 |
| outerwear | $898 | 23% | 4,142 |
| activewear | $78 | 19% | 3,509 |
| swimwear | $96 | 23% | 2,709 |
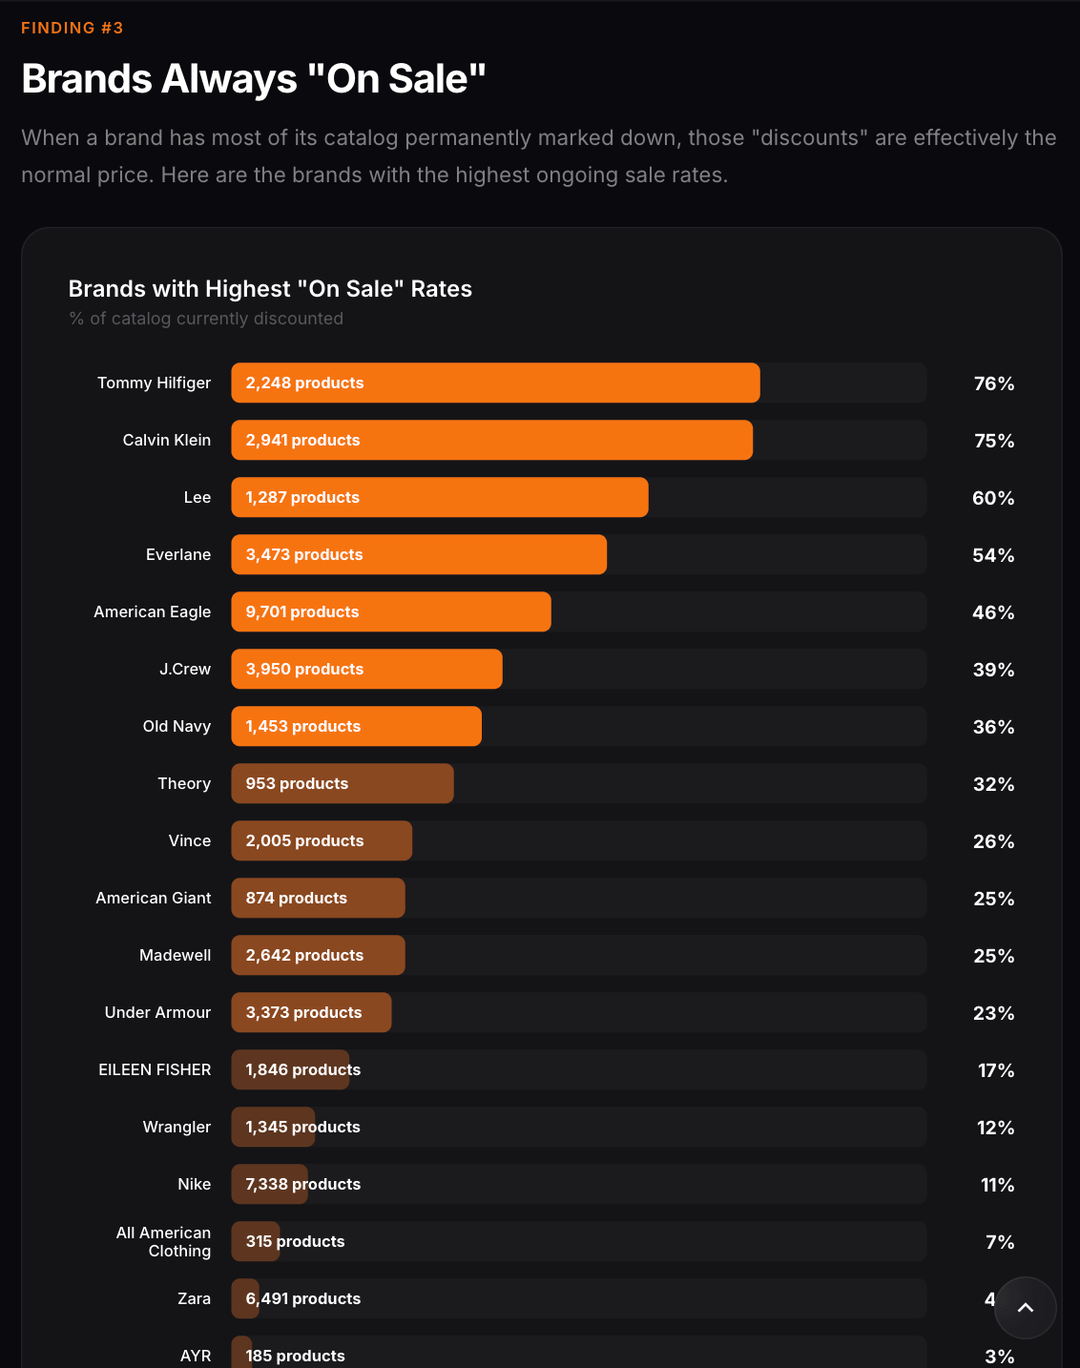
**Brand price check** (drop from peak vs drop from 30-day average)
| Brand | From Peak | From 30-Day Avg | Verdict |
|---|---|---|---|
| American Eagle | 27% | 12% | Real Drop |
| Calvin Klein | 36% | 17% | Real Drop |
| Everlane | 31% | 18% | Real Drop |
| Tommy Hilfiger | 26% | 13% | Real Drop |
| J.Crew | 38% | 18% | Real Drop |
| Under Armour | 10% | 4% | Steady Decline |
| Nike | 9% | 2% | Stable Price |
| Lee | 25% | 18% | Real Drop |
**How I'm doing this:** I pull prices from retailer sites every day and compare current prices against 30-day history. "Actually good price" means the product is within 2% of its 30-day low or 10%+ below its 30-day average. No affiliate links, no sponsored picks.
If you want me to look up a specific brand or product, just ask in the comments.
by dealhunterSam