
Methodology notes
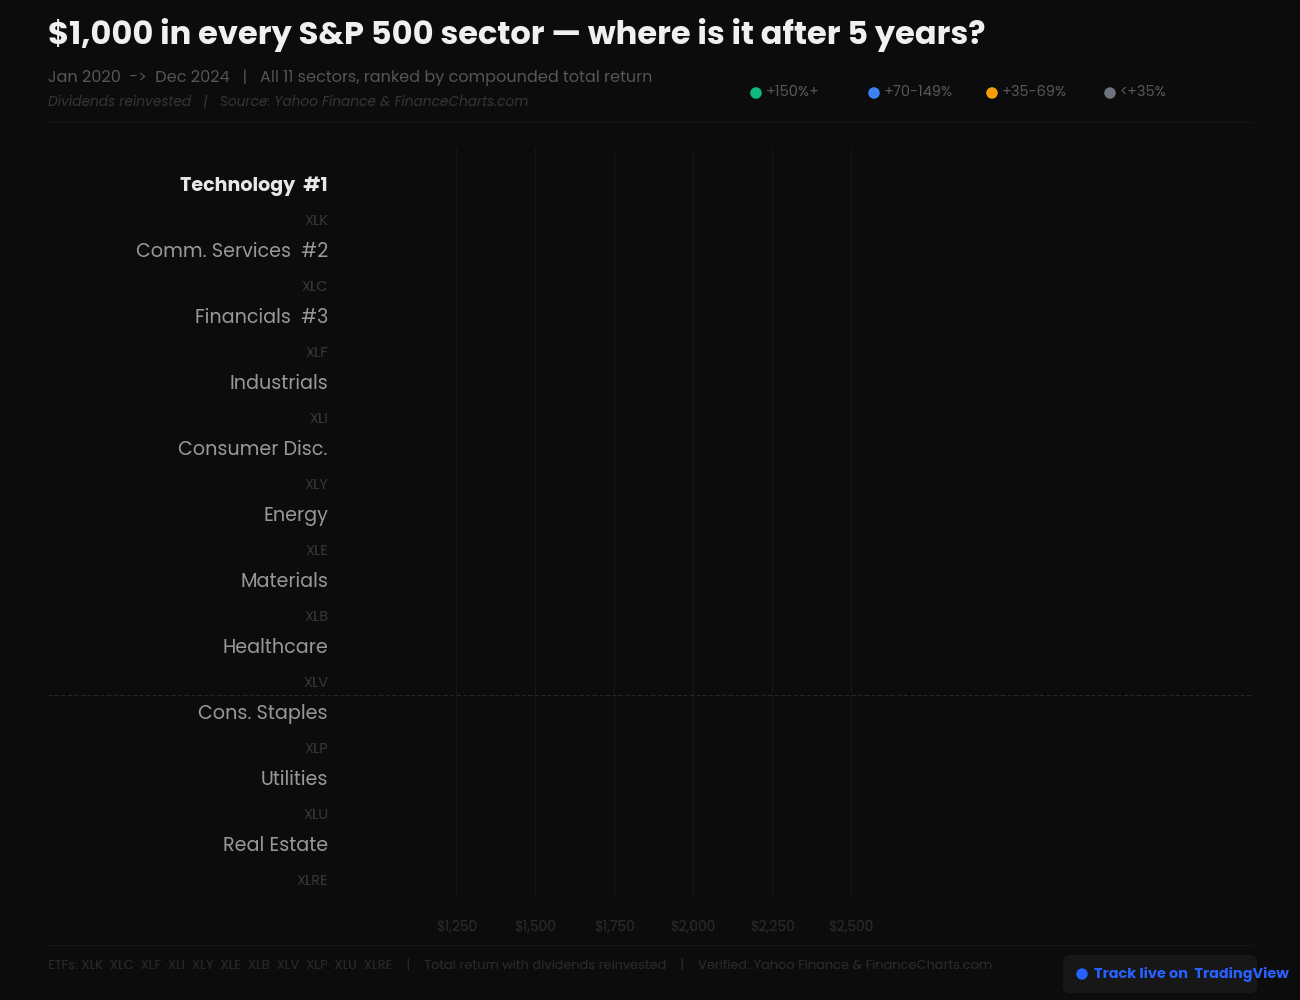
- All data: total return with dividends reinvested
- ETFs used: XLK, XLC, XLF, XLI, XLY, XLE, XLB, XLV, XLP, XLU, XLRE
- Data sources: Yahoo Finance, FinanceCharts.com, LazyPortfolioETF.com
- Period: January 1, 2020 — December 31, 2024
- No leverage, no rebalancing, equal $1,000 per sector at start
- Tech: +43.6%, +34.7%, −27.7%, +56.0%, +21.6%
- Energy: −32.5%, +53.3%, +64.2%, −0.6%, +5.6% ← wild ride
- Real Estate: −5.2%, +46.2%, −26.3%, +12.4%, +5.1%
The $1,415 gap between Tech ($2,655) and Real Estate ($1,237) is what gets people. Same starting point. Same years. Zero stock picking.
Reading Resource: https://medium.com/@interestingamerica/i-put-1-000-into-every-s-p-500-sector-in-2020-five-years-later-the-gap-is-1-418-7fd1fb770141
by the_h1b_records