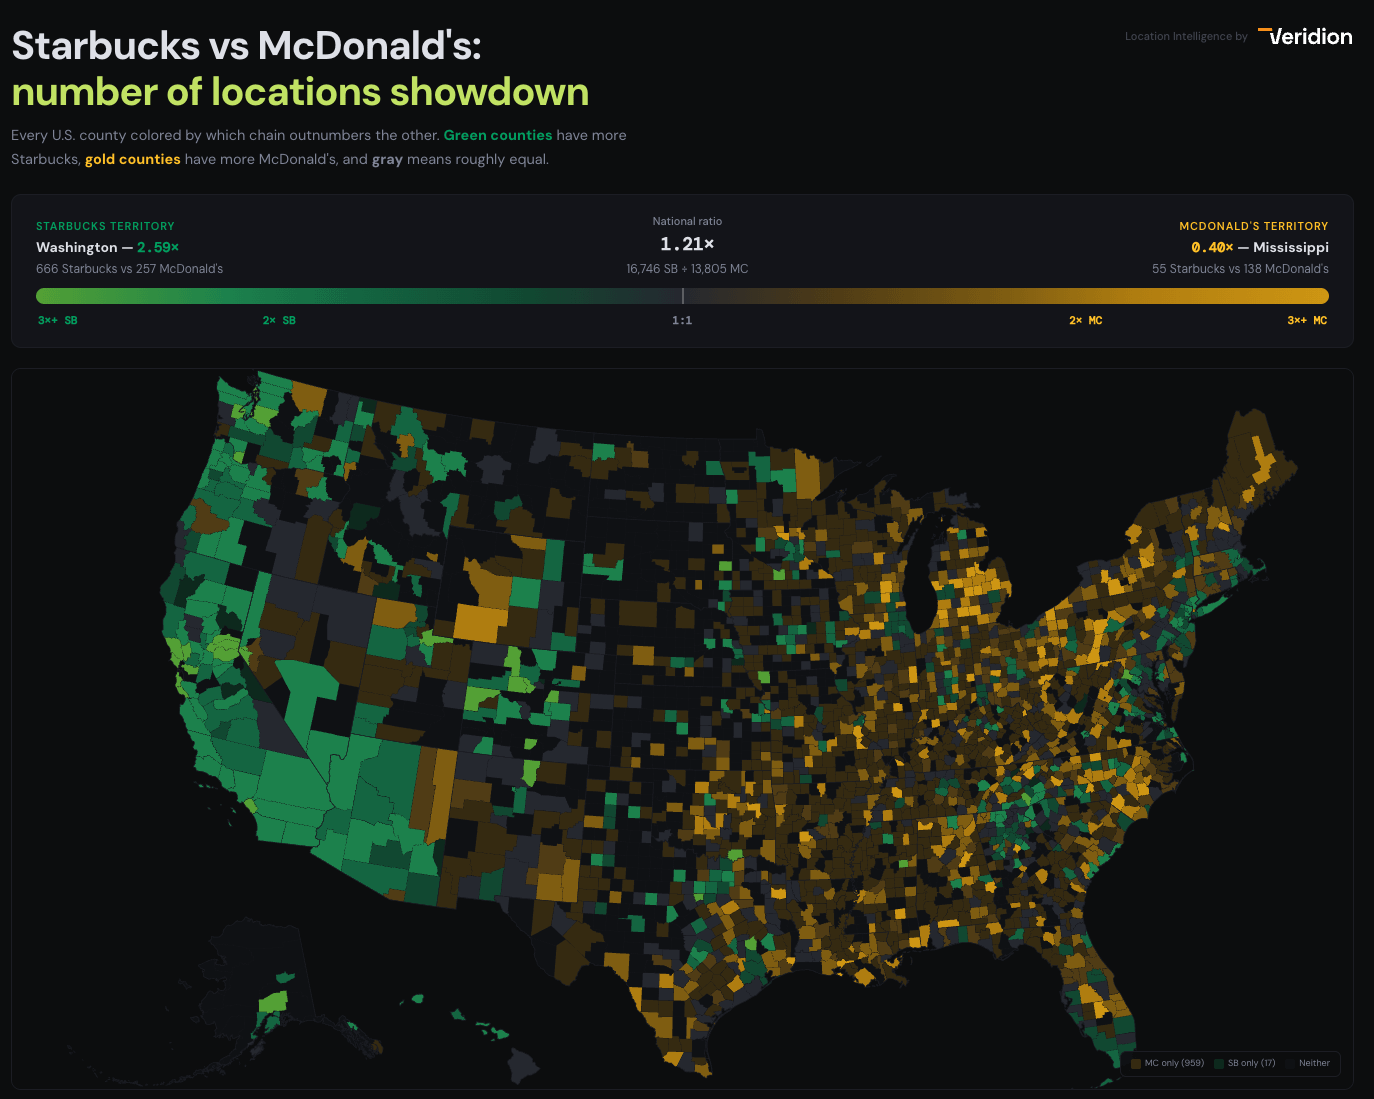
* Starbucks: 16,746 U.S. locations (Feb 2026)
* McDonald’s: 13,805 U.S. locations (Feb 2026)
* For both Starbucks and McDonald’s, the counts are sourced from [https://simplemaps.com/](https://simplemaps.com/) and detailed business location data from Veridion
* County boundaries: U.S. Census Bureau TIGER/Line via [us-atlas](https://github.com/topojson/us-atlas) (3,231 counties)
Methodology:
Each store was assigned to a county via a point-in-polygon spatial join. Counties are colored by the Starbucks-to-McDonald’s ratio on a diverging green–gray–gold scale.
Tools:
Python (Shapely) for spatial joins, D3.js + TopoJSON for the map, React for the UI. Built with Claude.
AdamColligan on
Your labeling is odd here. Calling it a “number of locations” showdown and having a “+” in the symbology at first made me think it was doing a comparison of absolute numbers. Then when you label the extremes for states and the national average, you use a fixed ratio based on SB/MC. But on your legend, you flip the ratio depending on which side you’re on.

2 Comments
Sources:
* Starbucks: 16,746 U.S. locations (Feb 2026)
* McDonald’s: 13,805 U.S. locations (Feb 2026)
* For both Starbucks and McDonald’s, the counts are sourced from [https://simplemaps.com/](https://simplemaps.com/) and detailed business location data from Veridion
* County boundaries: U.S. Census Bureau TIGER/Line via [us-atlas](https://github.com/topojson/us-atlas) (3,231 counties)
Methodology:
Each store was assigned to a county via a point-in-polygon spatial join. Counties are colored by the Starbucks-to-McDonald’s ratio on a diverging green–gray–gold scale.
Tools:
Python (Shapely) for spatial joins, D3.js + TopoJSON for the map, React for the UI. Built with Claude.
Your labeling is odd here. Calling it a “number of locations” showdown and having a “+” in the symbology at first made me think it was doing a comparison of absolute numbers. Then when you label the extremes for states and the national average, you use a fixed ratio based on SB/MC. But on your legend, you flip the ratio depending on which side you’re on.