
I’m occasionally frustrated that my kids' developmental milestone achievements are reported purely as boolean: "By 9 months, he should be doing X." But obviously there is a distribution of when kids hit those milestones! It's just not easy to find what it looks like!
I found two datasets from large US studies that include actual parameter data for a variety of milestones.
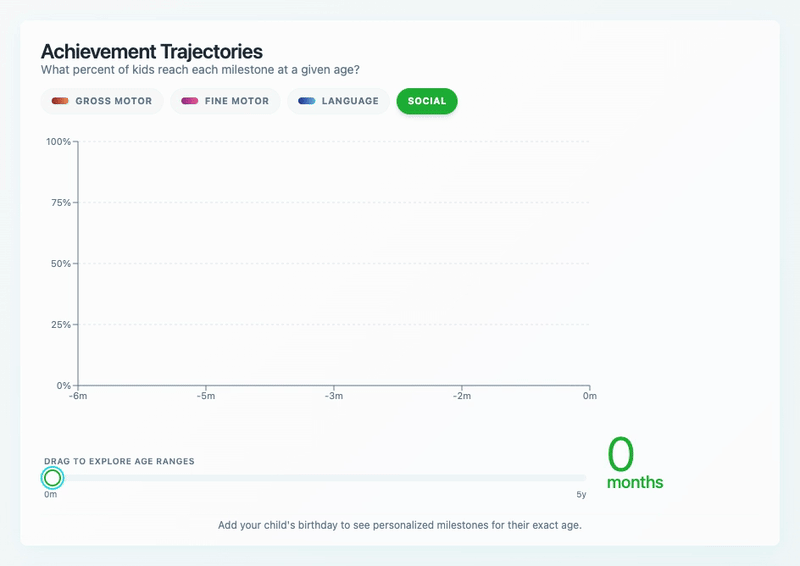
So I categorized the achievements and used those parameters to visualize them on a filterable, scrollable timeline.
link: https://kids.batna.dev/achievements
(Note that these are different than CDC milestones, and CDC uses different/more data to come up with their recommendations. Don't panic!)
Data Sources:
- Sheldrick, R. C., & Perrin, E. C. (2013). Evidence-Based Milestones for Surveillance of Cognitive, Language, and Motor Development. Based on a sample of 1,172 families.
- Frankenburg et al. (1990). Denver II Technical Manual for specific motor markers (Standing alone, etc.)
Tools:
- Item Characteristic Curve (ICC) parameters from the paper to produce the s-curves
- Recharts for plotting
by palmeryan
4 Comments
Wow this has me thinking of new dystopian metrics that helicopter parents might use to determine if their kid is too far behind. Honestly I’m kinda not for this kind of measurement of children.
Amazing post. Data is useful, looks good, and is novel.
I once found a book my mum wrote and I just remember “he still colors over the lines” and I was devastated she judged my drawings and drew extra careful from that day on. Hahahaha
Unfortunately there’s no way to zoom in on the animation to make the text big enough to read.