
Source: Transparency International — Corruption Perceptions Index (annual country scores, 2015–2025): https://www.transparency.org/en/cpi
Tool: Kasipa (https://kasipa.com/graph/pSw2b2yR)
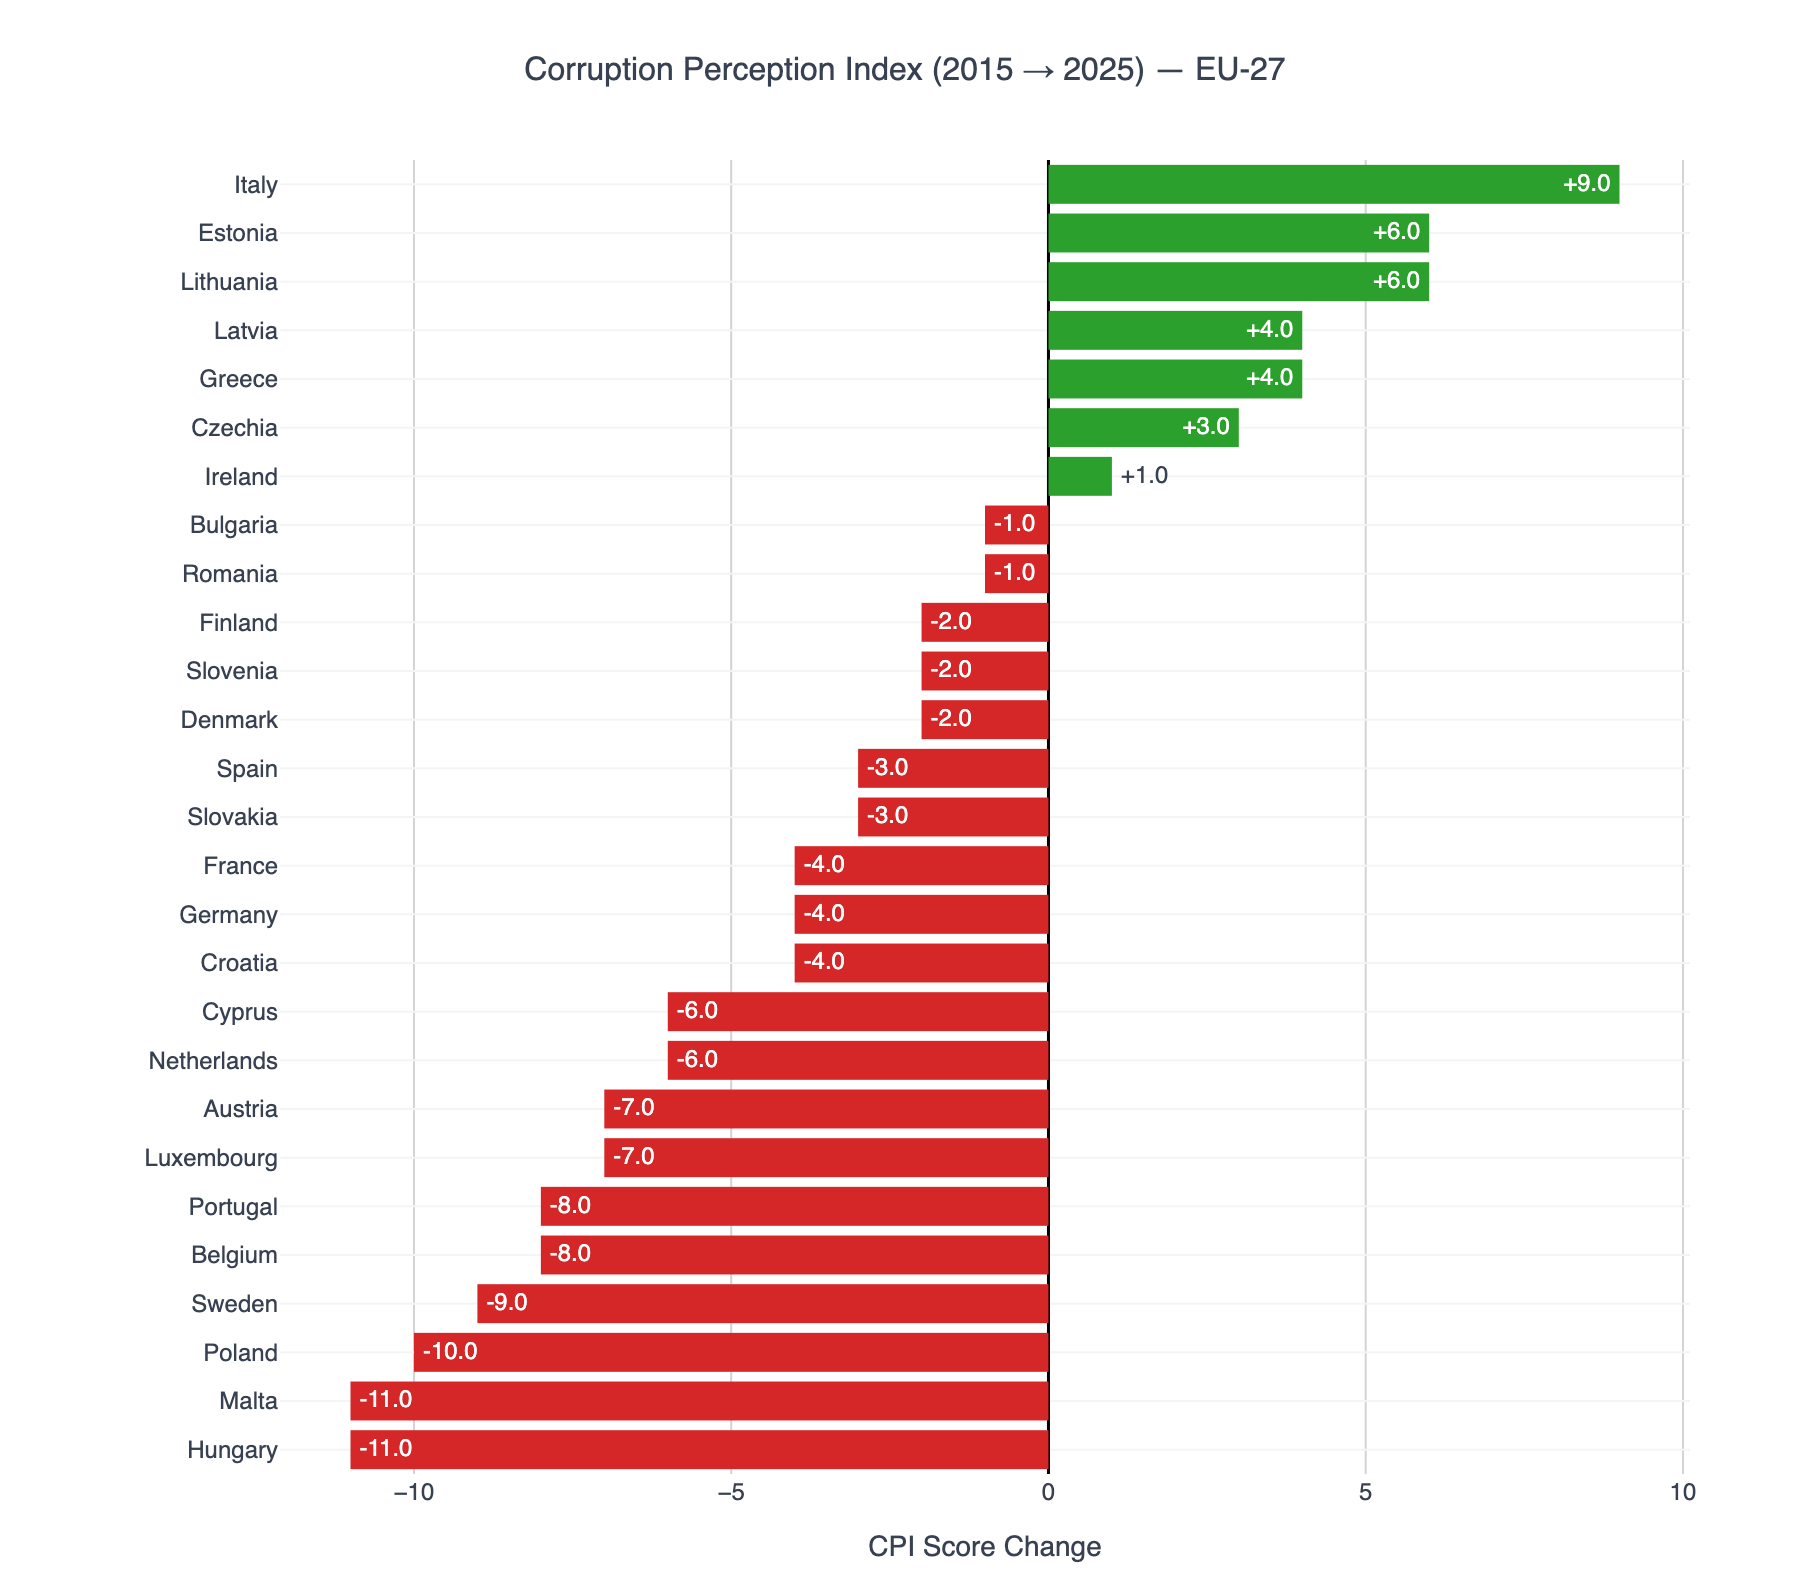
Method: EU-27 countries filtered from CPI country-year scores (higher score = lower perceived public-sector corruption).
by dcastm
3 Comments
Surprised to see Sweden in the red
Can I have a line chart for all EU countries and for all years in that period?
I really don’t like this viz. Think you should have both actual scores and changes. I understand that it’s user error to read into this that Sweden is doing bad or Italy well, but it’s also the responsibility of the creator to make something that shows the most useful information and shows it in a way that’s easy to digest.