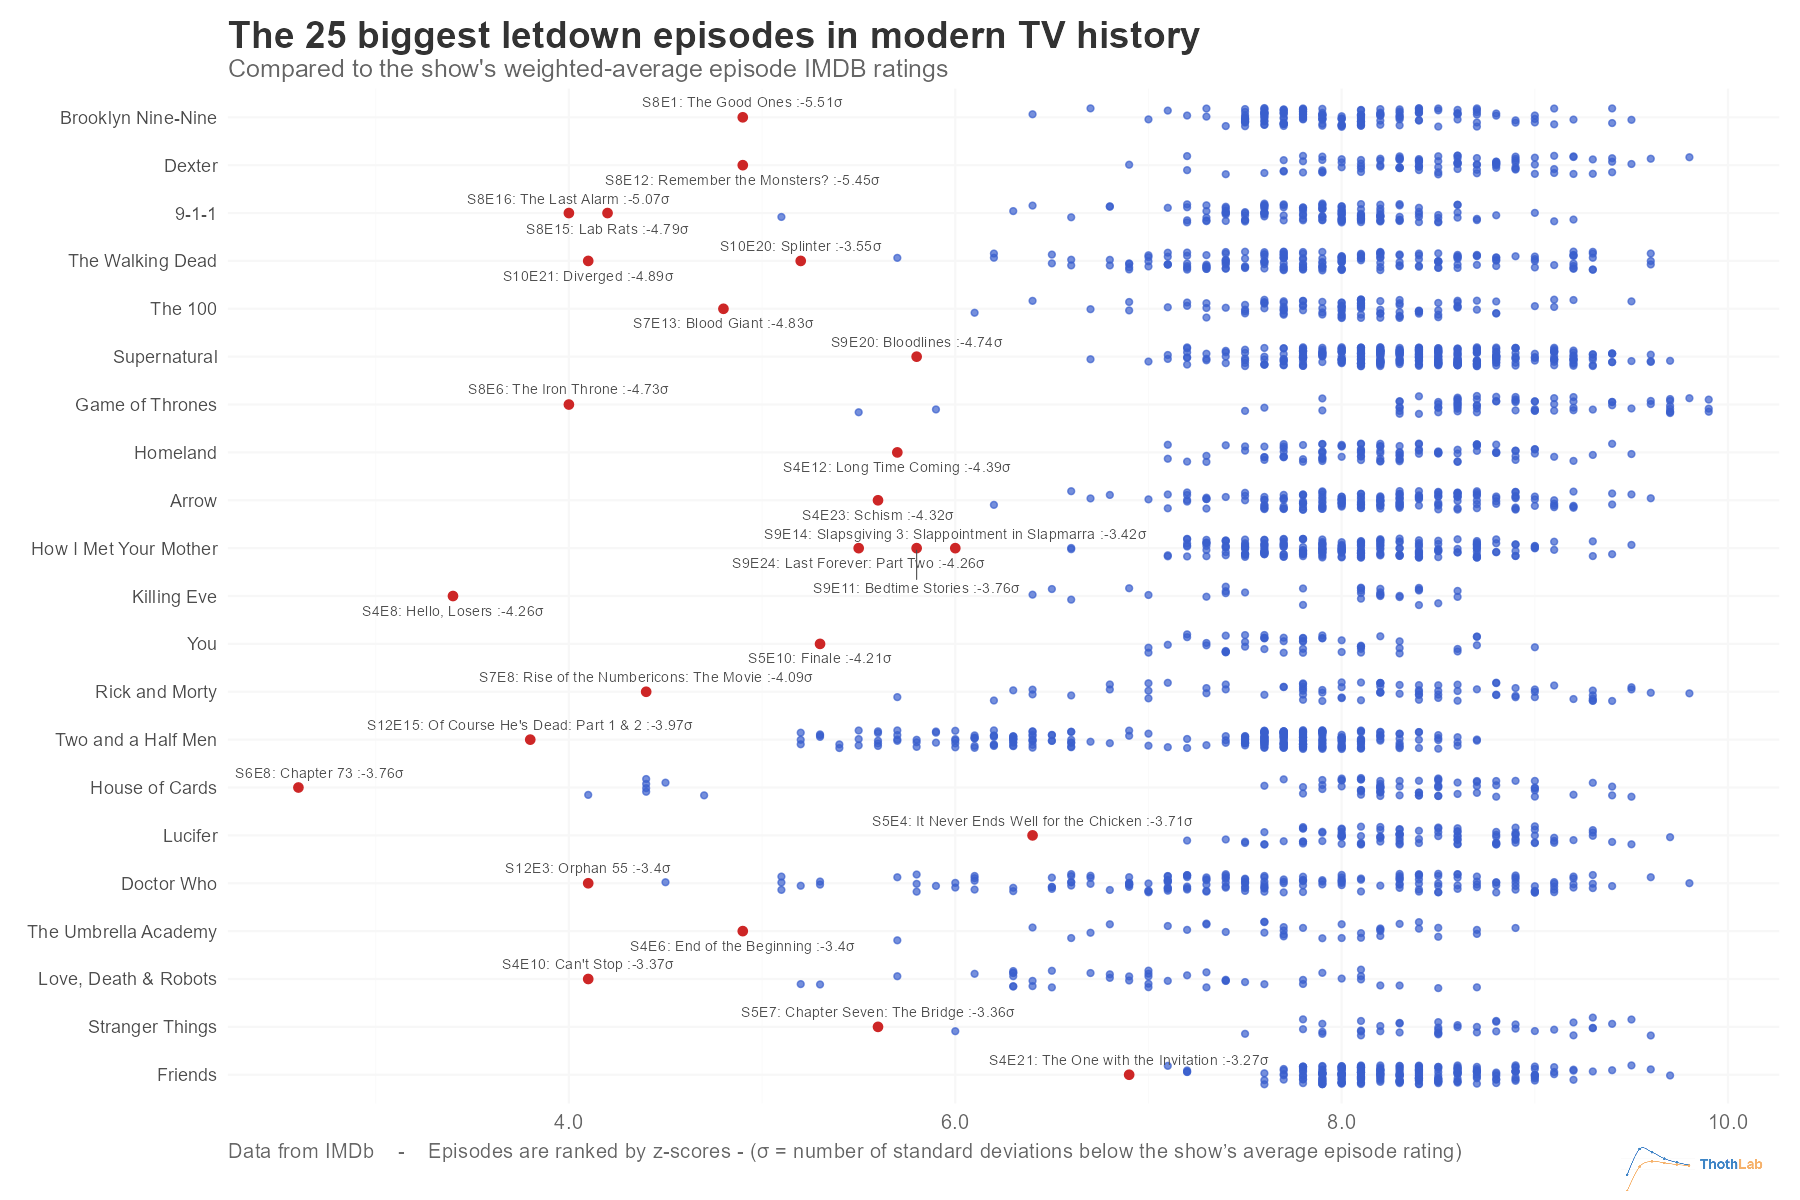
varisophy on February 14, 2026 5:53 am This is cool, but Love, Death, & Robots is an anthology series so it doesn’t make a whole lot of sense to be on this chart.
cool_hand_legolas on February 14, 2026 6:01 am you have the label with standard deviation, kinda makes me wish the whole thing was z scores
squareabbey on February 14, 2026 6:03 am The Friends episode is a clip show, so I wouldn’t say it’s a let down so much as a skippable filler episode.

3 Comments
This is cool, but Love, Death, & Robots is an anthology series so it doesn’t make a whole lot of sense to be on this chart.
you have the label with standard deviation, kinda makes me wish the whole thing was z scores
The Friends episode is a clip show, so I wouldn’t say it’s a let down so much as a skippable filler episode.