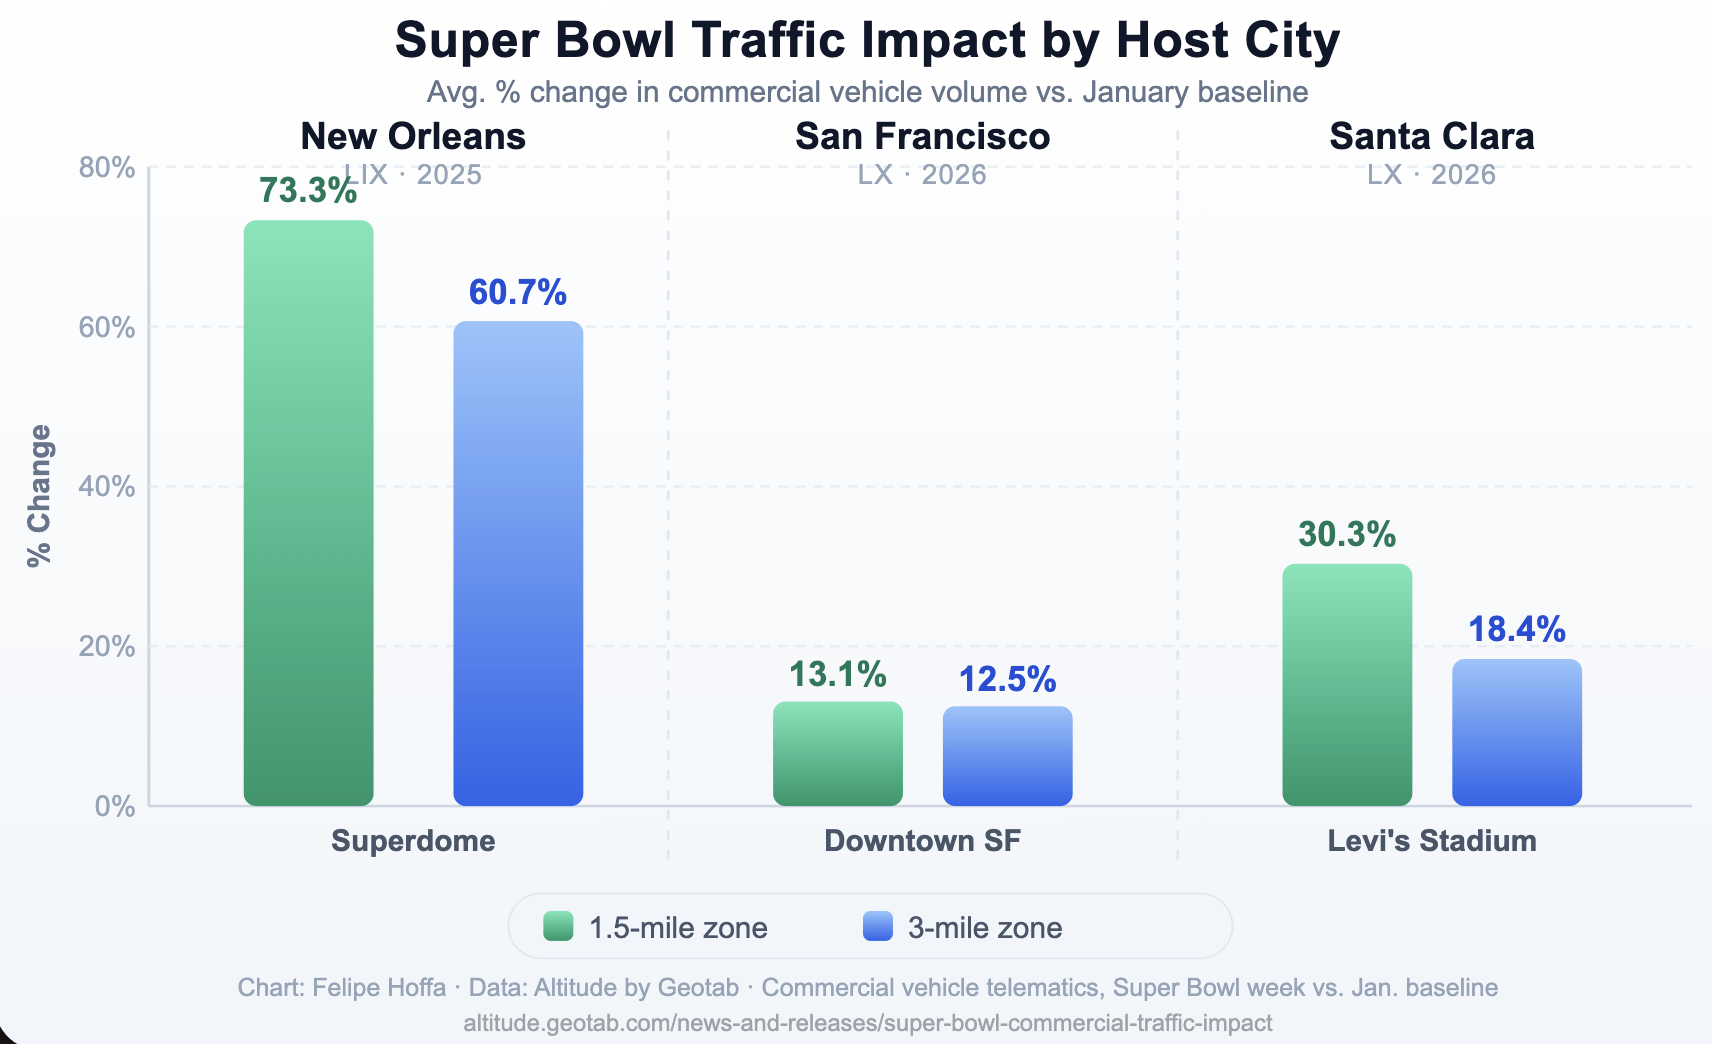
[OC] Even without hosting, SF saw a +13% Super Bowl traffic bump — Santa Clara was +30%, New Orleans (last year) +73% by fhoffa
fhoffa on February 11, 2026 12:07 am Data source: [https://altitude.geotab.com/news-and-releases/super-bowl-commercial-traffic-impact/](https://altitude.geotab.com/news-and-releases/super-bowl-commercial-traffic-impact/) Tools: I took the data shared in the report, charts shared – and transformed it into a SVG with Claude to improve scaling for comparison purposes, and added clarity on years when the data was measured and how. The original chart: [https://altitude.geotab.com/wp-content/uploads/sites/3/2026/02/super-bowl-blog-plot.png](https://altitude.geotab.com/wp-content/uploads/sites/3/2026/02/super-bowl-blog-plot.png) Disclosure: I work at Geotab, and I love playing with this data.
The-original-spuggy on February 11, 2026 12:26 am Probably because volumes near Levi stadium is a lot greater on a normal day than the areas near the Superdome

2 Comments
Data source: [https://altitude.geotab.com/news-and-releases/super-bowl-commercial-traffic-impact/](https://altitude.geotab.com/news-and-releases/super-bowl-commercial-traffic-impact/)
Tools: I took the data shared in the report, charts shared – and transformed it into a SVG with Claude to improve scaling for comparison purposes, and added clarity on years when the data was measured and how.
The original chart: [https://altitude.geotab.com/wp-content/uploads/sites/3/2026/02/super-bowl-blog-plot.png](https://altitude.geotab.com/wp-content/uploads/sites/3/2026/02/super-bowl-blog-plot.png)
Disclosure: I work at Geotab, and I love playing with this data.
Probably because volumes near Levi stadium is a lot greater on a normal day than the areas near the Superdome