
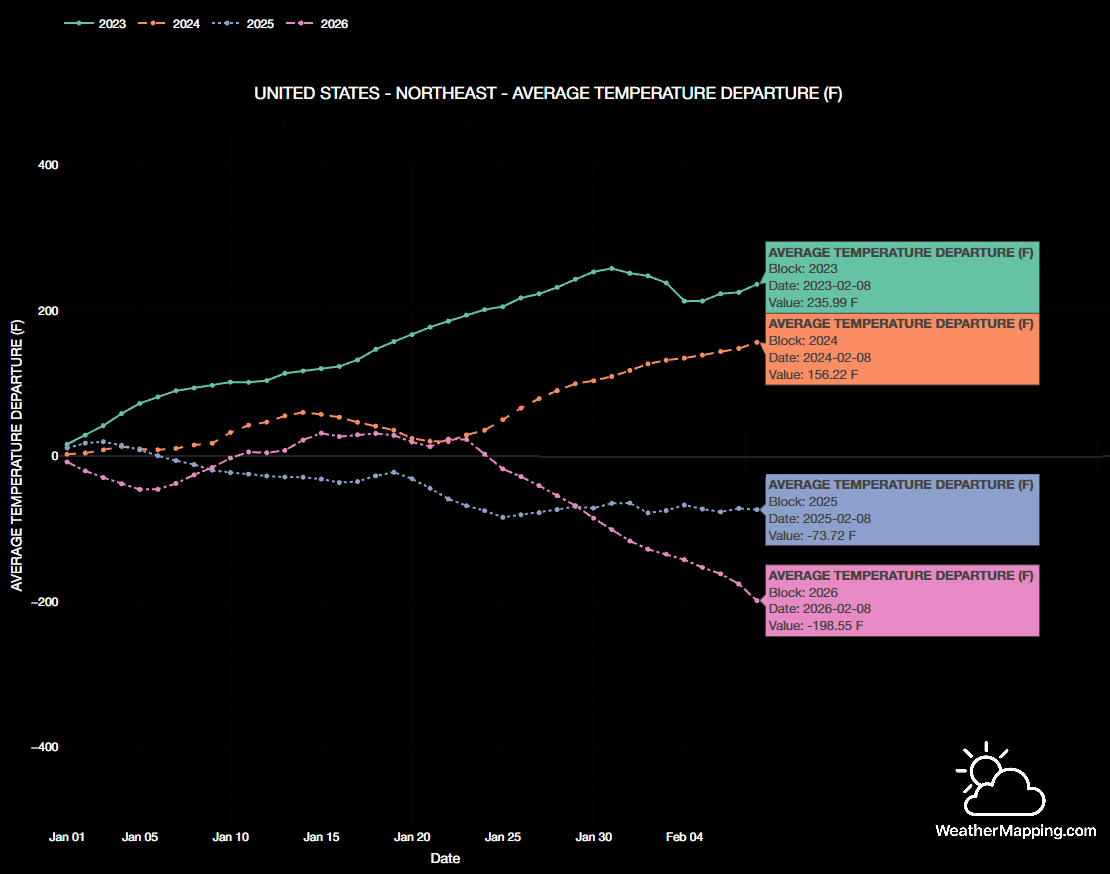
This chart shows cumulative average temperature departures from normal (°F) for the U.S. Northeast from January 1 through February 8 for the years 2023–2026. Daily temperature anomalies are calculated relative to a climatological baseline, then cumulatively summed to highlight persistent warmth or cold over time.
Data were processed and visualized using WeatherMapping.com, with Plotly used as the visualization engine.
by ferguskeatinge
3 Comments
**Source:**
Daily average temperature data processed via [WeatherMapping.com](http://WeatherMapping.com), using weather station temperature fields for the U.S. Northeast. Temperature departures are calculated relative to a climatological normal and aggregated regionally.
**Methods:**
For each year, daily average temperature departures (°F) were computed relative to the climatological baseline and cumulatively summed from January 1 through February 8 to emphasize persistence of warm or cold conditions rather than individual daily extremes.
**Tool:**
Visualization created using Plotly via WeatherMapping.com.
By February 8, 2023 finishes at +235.99°F cumulative, while 2026 is at −198.55°F. That is roughly a 435°F difference over the same year-to-date period, driven by sustained warmth in 2023 versus persistent cold in 2026, not just isolated weather events.
If you live in the U.S. Northeast, your body is definitely feeling it right now, and so is your heating bill….
The “cumulative” F scale took a while to understand. It might have more value to go back to November 1st.
It’s definitely the coldest we’ve had in years (-20C last night) and with much more snow. With the Great Lakes being much more frozen than normal the snow would not be expected.