
Data source: Anthropic, Synthetic, and Z.ai quota APIs polled every 60 seconds
Tools: onWatch (Go, Chart.js, SQLite)
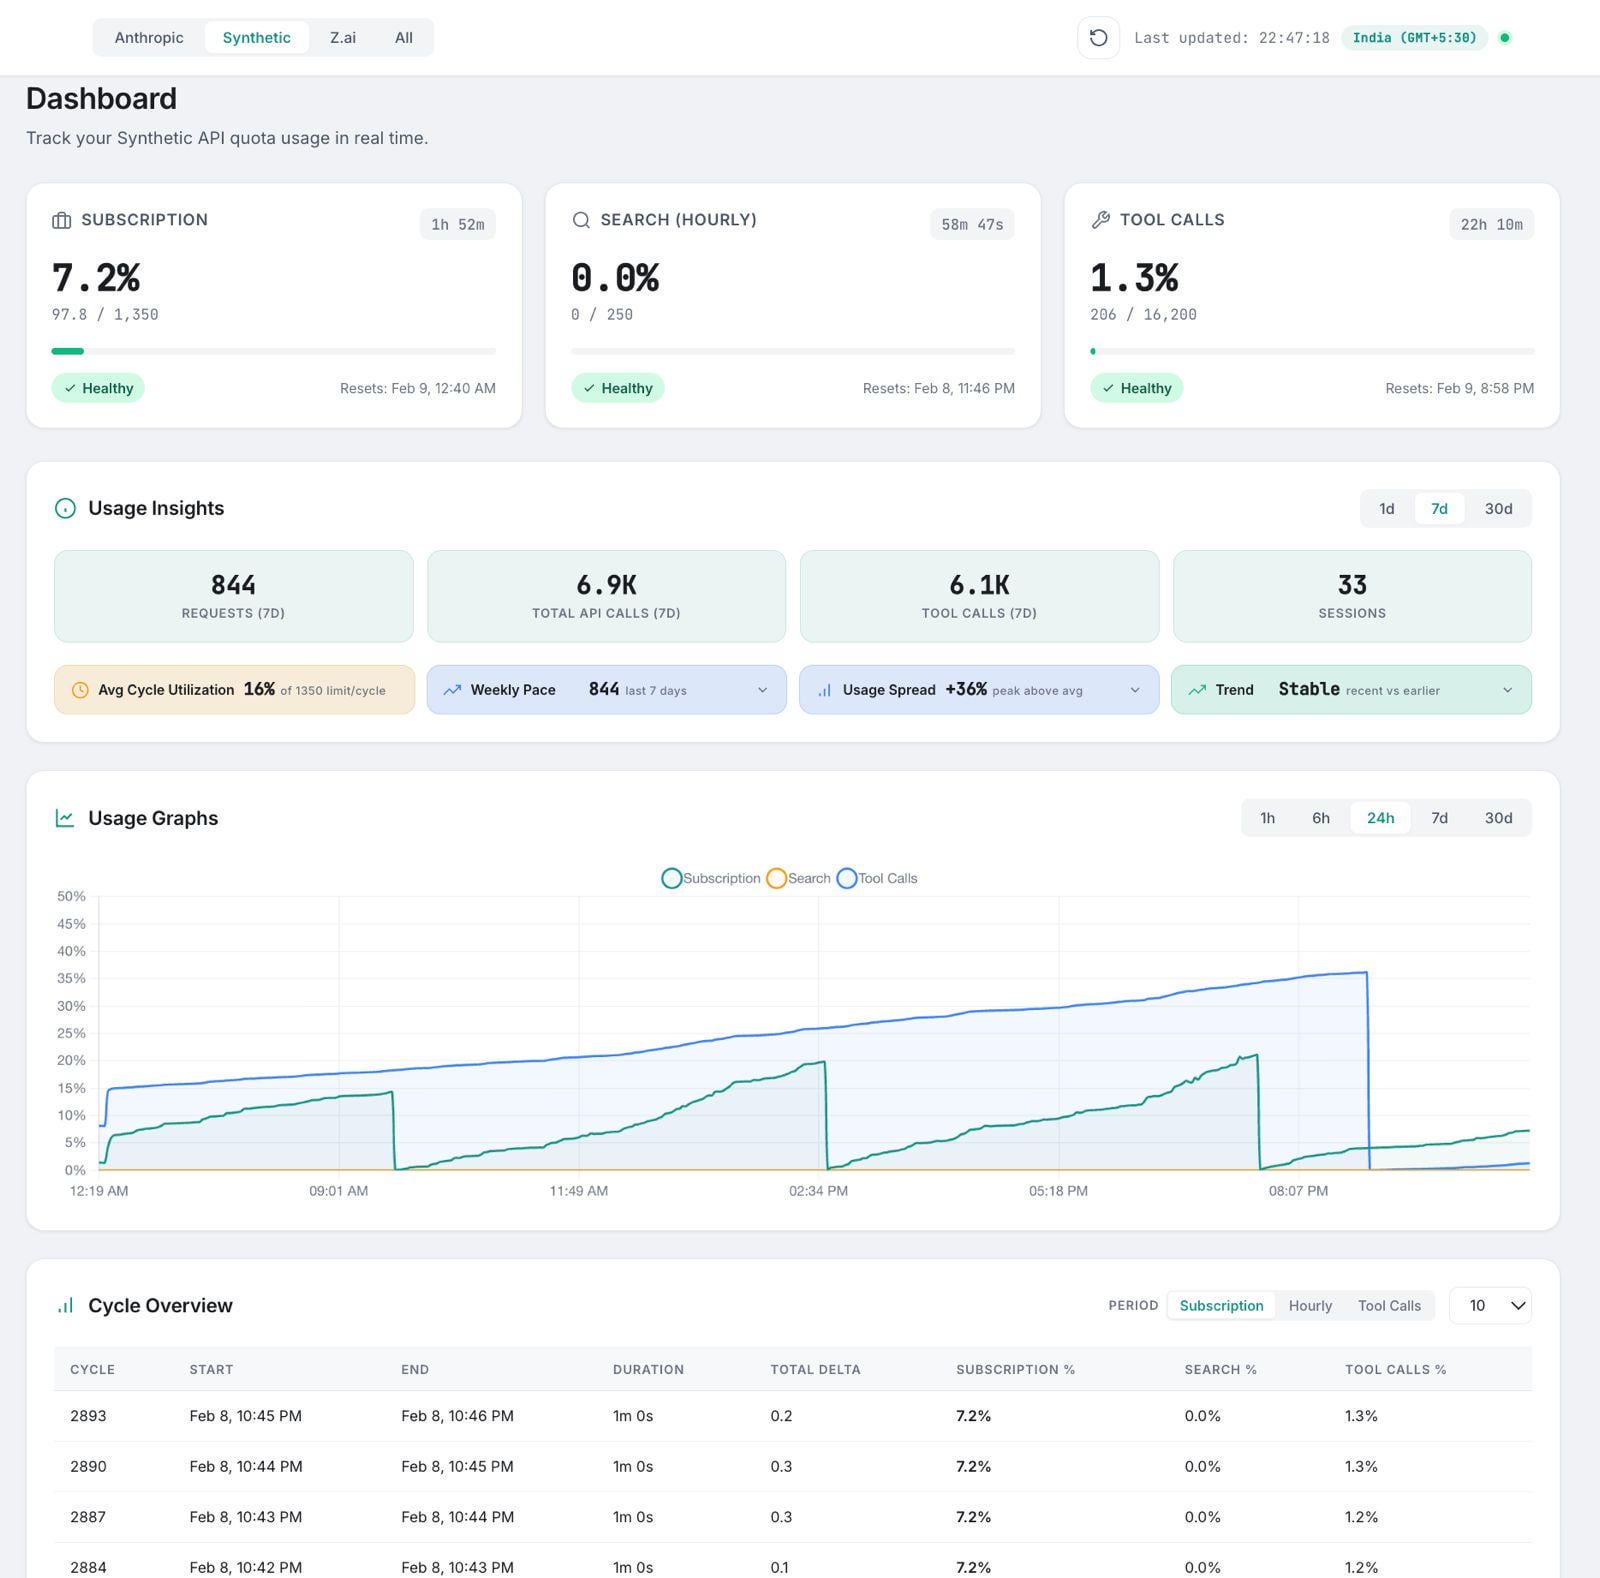
This shows my usage patterns across three AI coding API providers over the past week. The graph tracks utilization as a percentage of each quota limit over time. You can see the 5-hour and weekly reset cycles on Anthropic, the roughly 5-hour subscription cycle on Synthetic, and daily token usage on Z.ai.
The spikes line up with coding sessions during work hours. Weekdays burn through the 5-hour window much faster than weekends. The sawtooth pattern on Synthetic shows the search quota hitting close to the 250 per hour limit and resetting.
Built the tool that generates these charts. Free and open source.
https://onwatch.onllm.dev
https://github.com/onllm-dev/onWatch
by prakersh