
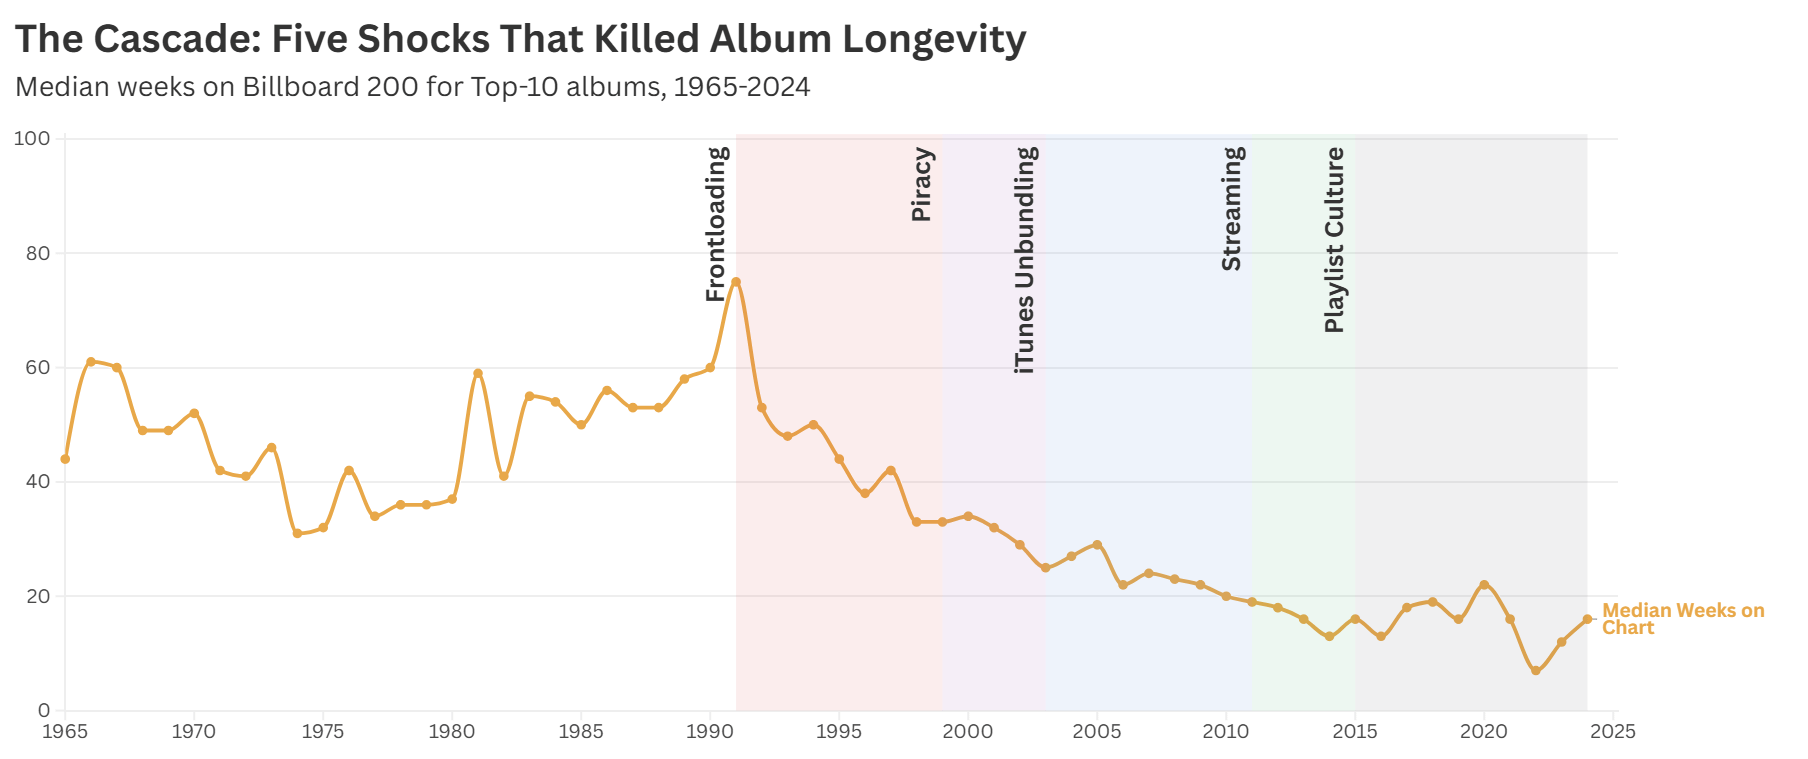
Source: Billboard 200 Weekly Chart, 1963-2025 via Kaggle (639,746 entries, 39,382 unique albums). Tracked every album that reached the Top 10 from 1965 to 2024 by total weeks on chart. Median calculated per year. Visualization built in Flourish as I am learning how to use it.
The five colored phases on the chart:
Frontloading (1991-99): SoundScan made first-week numbers visible. Labels shifted to launch-spike strategy. Top-10 albums per 5-year period jumped from 280 to 438.
Piracy (1999-2003): Napster, Kazaa, LimeWire. But the median had already dropped 31% before Napster launched.
iTunes (2003-2011): $0.99 singles unbundled the album. Exposed that most albums weren't worth $16 after a decade of filler padding.
Streaming (2011-2015): Spotify eliminated purchase. Billboard added streaming to chart methodology in 2014, changing what "charting" even measures.
Playlist Culture (2015-2024): Algorithm-driven discovery replaced album loyalty. Median hit 7 weeks in 2022.
The line never recovered between shocks. Each one landed before the industry absorbed the previous one.
by Traditional_Rise_609
3 Comments
I dunno, looks like a smooth decline, not a series of shocks
Here is part 2: [https://roguesgalleryprog.substack.com/p/hits-dont-last-anymore-part-2](https://roguesgalleryprog.substack.com/p/hits-dont-last-anymore-part-2) it has a link back to Part 1 at the top which is where I started until the content got too much for a single post. I have probably one more post after this with the rest of the data I pulled, but am still working on it.
The labels are in a terrible location, not clear at all which section they represent without reading the description