
By "data" we mean data that's used in businesses. Interactive map of this and related findings available at https://www.doubletrack.com/post/hidden-cost-dirty-data
Data Sources
- U.S. Census Bureau, County Business Patterns (2023): Employment and establishment counts by industry (2-digit NAICS), state, and county. Dataset covers 8.36 million establishments and 139.8 million employees. census.gov/data/datasets/2023/econ/cbp/2023-cbp.html
- Gartner, Magic Quadrant for Data Quality Solutions (July 2020): Survey of 154 enterprise customers on estimated cost of poor data quality. gartner.com/en/data-analytics/topics/data-quality
- Flexera, 2020 State of Tech Spend Report: IT spending as percentage of revenue by industry, based on CIO surveys. flexera.com/blog/perspectives/it-spending-by-industry
- U.S. Bureau of Economic Analysis, Gross Domestic Product (Q3 2025): National GDP figure of $31.1 trillion used to calculate dirty data costs as a percentage of economic output. fred.stlouisfed.org/series/GDP
by doubletrack_sf
4 Comments
*Methodology notes…*
**Baseline Cost Figure**
The $12.9 million annual cost of poor data quality comes from Gartner’s Magic Quadrant for Data Quality Solutions (July 27, 2020, authors Melody Chien and Ankush Jain). Gartner surveyed 154 reference customers across 16 data quality vendors and asked them to estimate what poor data quality costs their organization.
These were large enterprises sophisticated enough to already be purchasing data quality software, companies that had done the work to understand and quantify the problem.
**Per-Employee Calculation**
U.S. Census Bureau County Business Patterns data (2023 release) shows businesses with 1,000+ employees average 2,626 employees per establishment. This aligns with Gartner’s survey population.
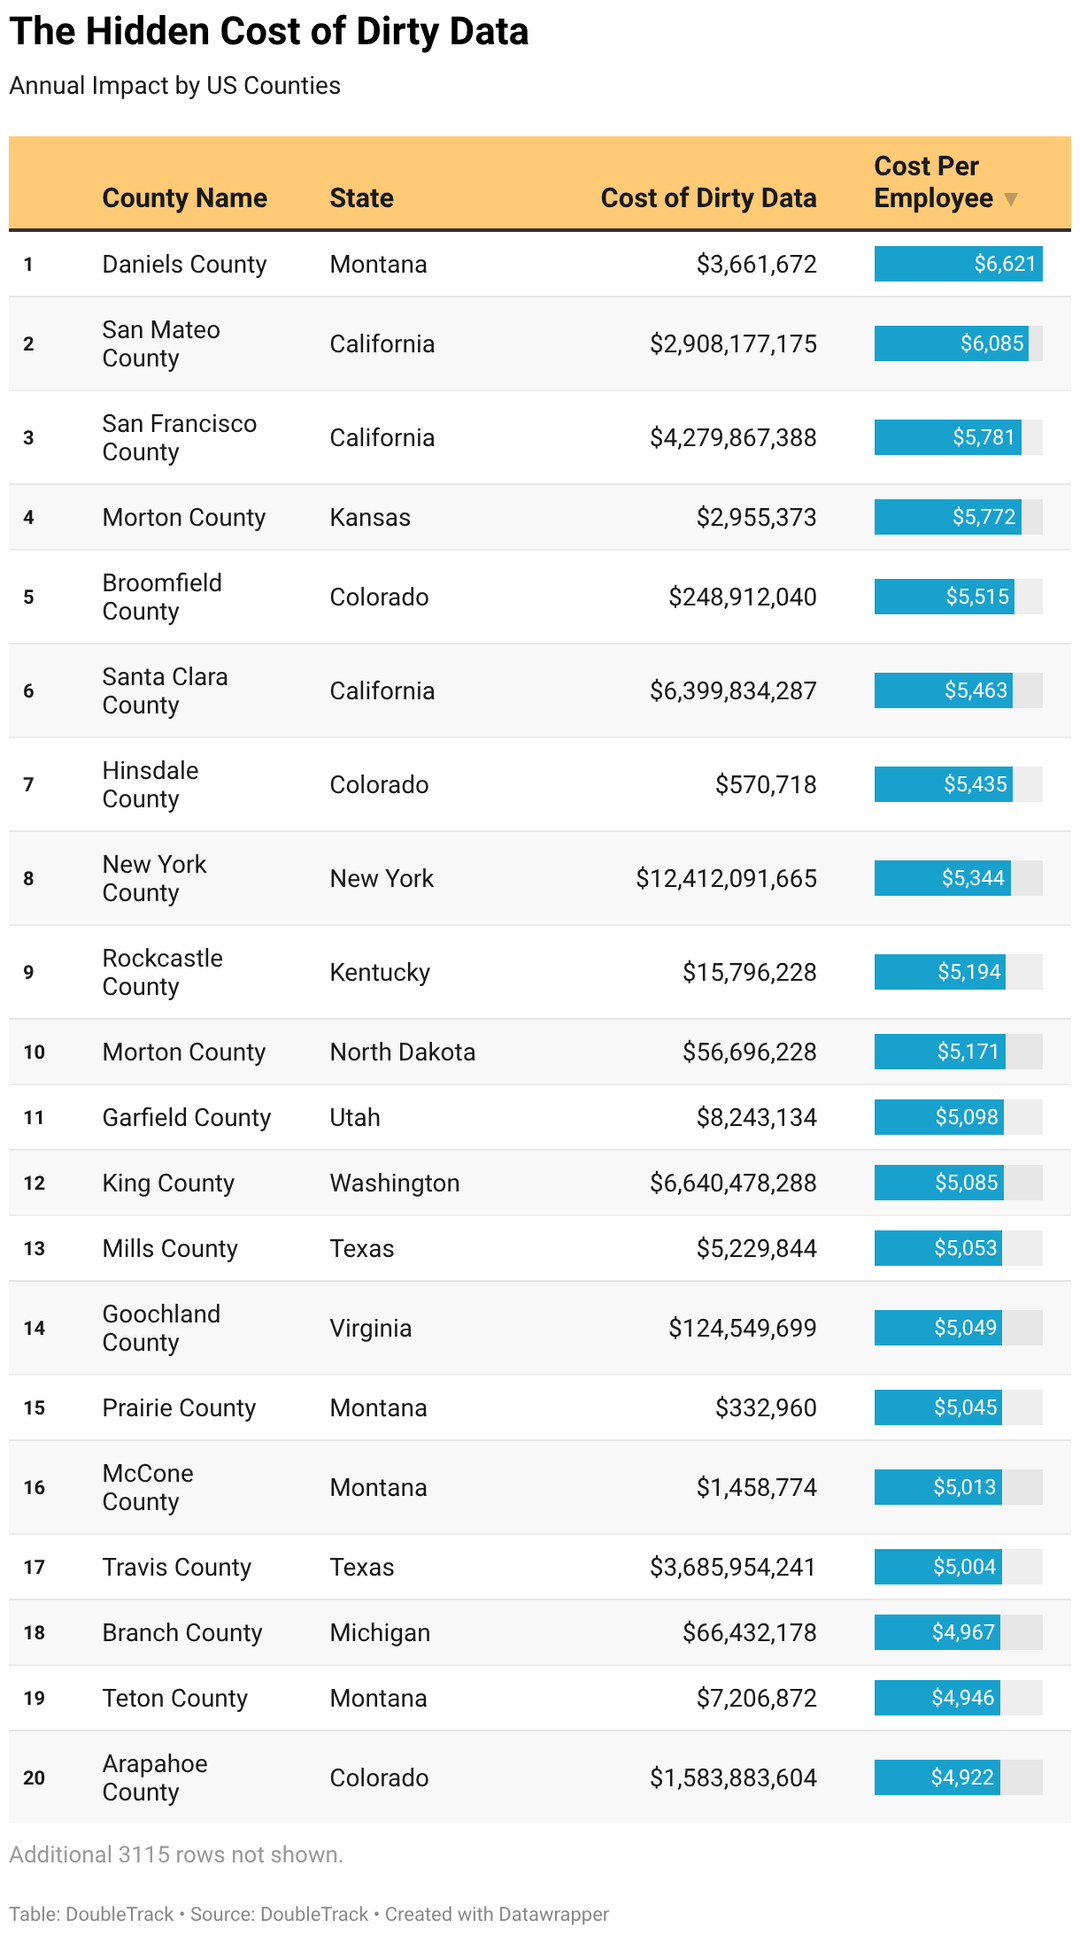
Dividing $12.9 million by 2,626 employees yields a baseline cost of $4,912 per employee per year. This per-employee figure was applied across all 139.8 million employees in the Census dataset.
**Industry Multipliers**
Different industries have different data intensities. We used Flexera’s 2020 State of Tech Spend Report, which surveys CIOs on IT spending as a percentage of revenue, to create industry-specific multipliers.
The weighted average IT spend across all industries is 8.2%. Industries spending more than this average have higher data complexity and greater exposure to data quality costs; industries spending less have lower exposure.
Multipliers were calculated by dividing each industry’s IT spend percentage by the 8.2% weighted average.
For example: Software companies spend 24.7% of revenue on IT, yielding a multiplier of 3.01x. We averaged Software (3.01x) and Technology Hosting (1.94x) to produce a combined Information sector multiplier of 2.48x. Financial Services at 10% IT spend yields a 1.22x multiplier. Healthcare at 5% yields 0.61x. Retail at 6.2% yields 0.76x.
For industries not covered by Flexera’s survey (Construction, Wholesale Trade, Educational Services, Arts and Entertainment, Real Estate, Utilities, Mining, Agriculture, and Administrative Support), we applied a 1.00x multiplier, equivalent to the weighted average IT spend.
**Geographic Calculations**
State and county totals were calculated by applying the per-employee cost ($4,912) and industry multipliers to employment data from County Business Patterns.
For each geographic unit, we calculated: (Employees in Industry A × $4,912 × Industry A Multiplier) + (Employees in Industry B × $4,912 × Industry B Multiplier) for all industries present in that geography.
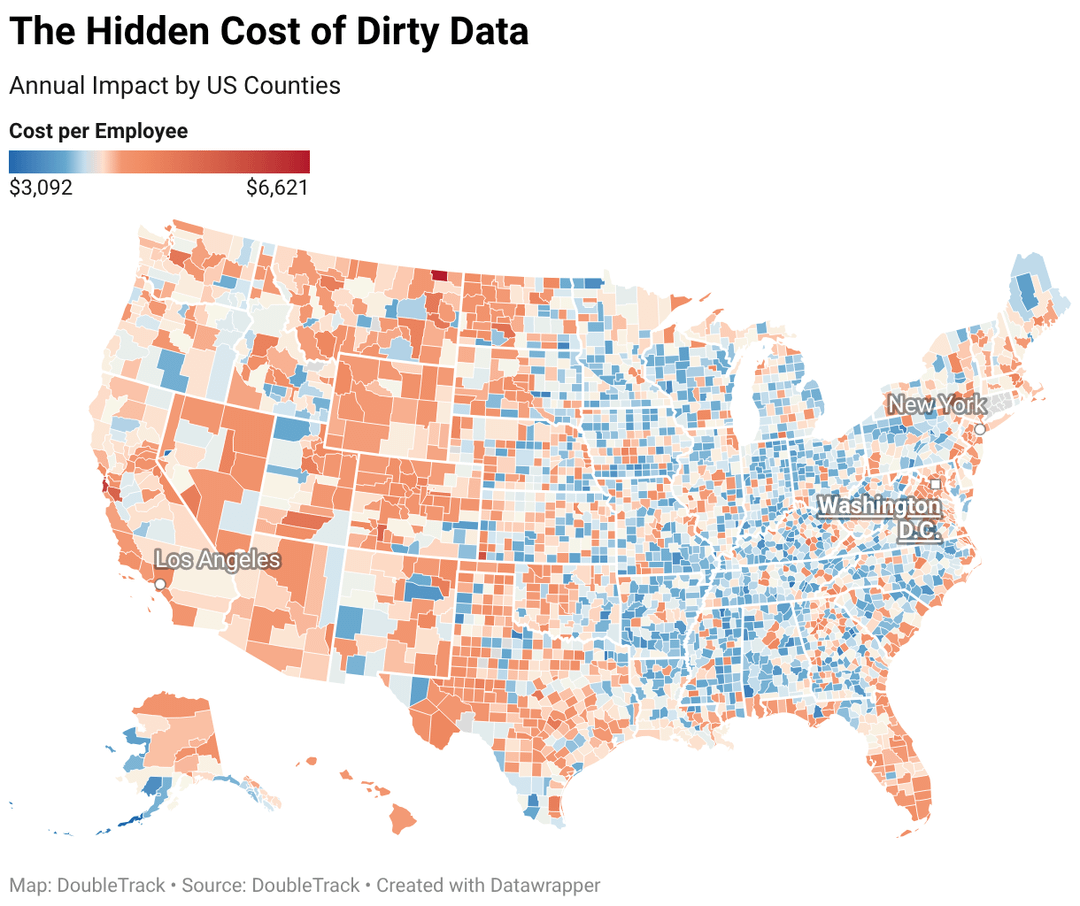
Cost per employee figures for states and counties reflect their industry mix. A county with high Information sector concentration will show a higher cost per employee than one dominated by hospitality, even though both use the same underlying methodology.
What question does this data answer?
So is this effectively a heatmap of **average per-employee IT spending per county**?
* flat $4912 per-employee value
* multiplier is based on IT spending per industry
* then just a weighted average based on headcount per industry
Why are you posting *dirty* data to r/dataisbeautiful? /s