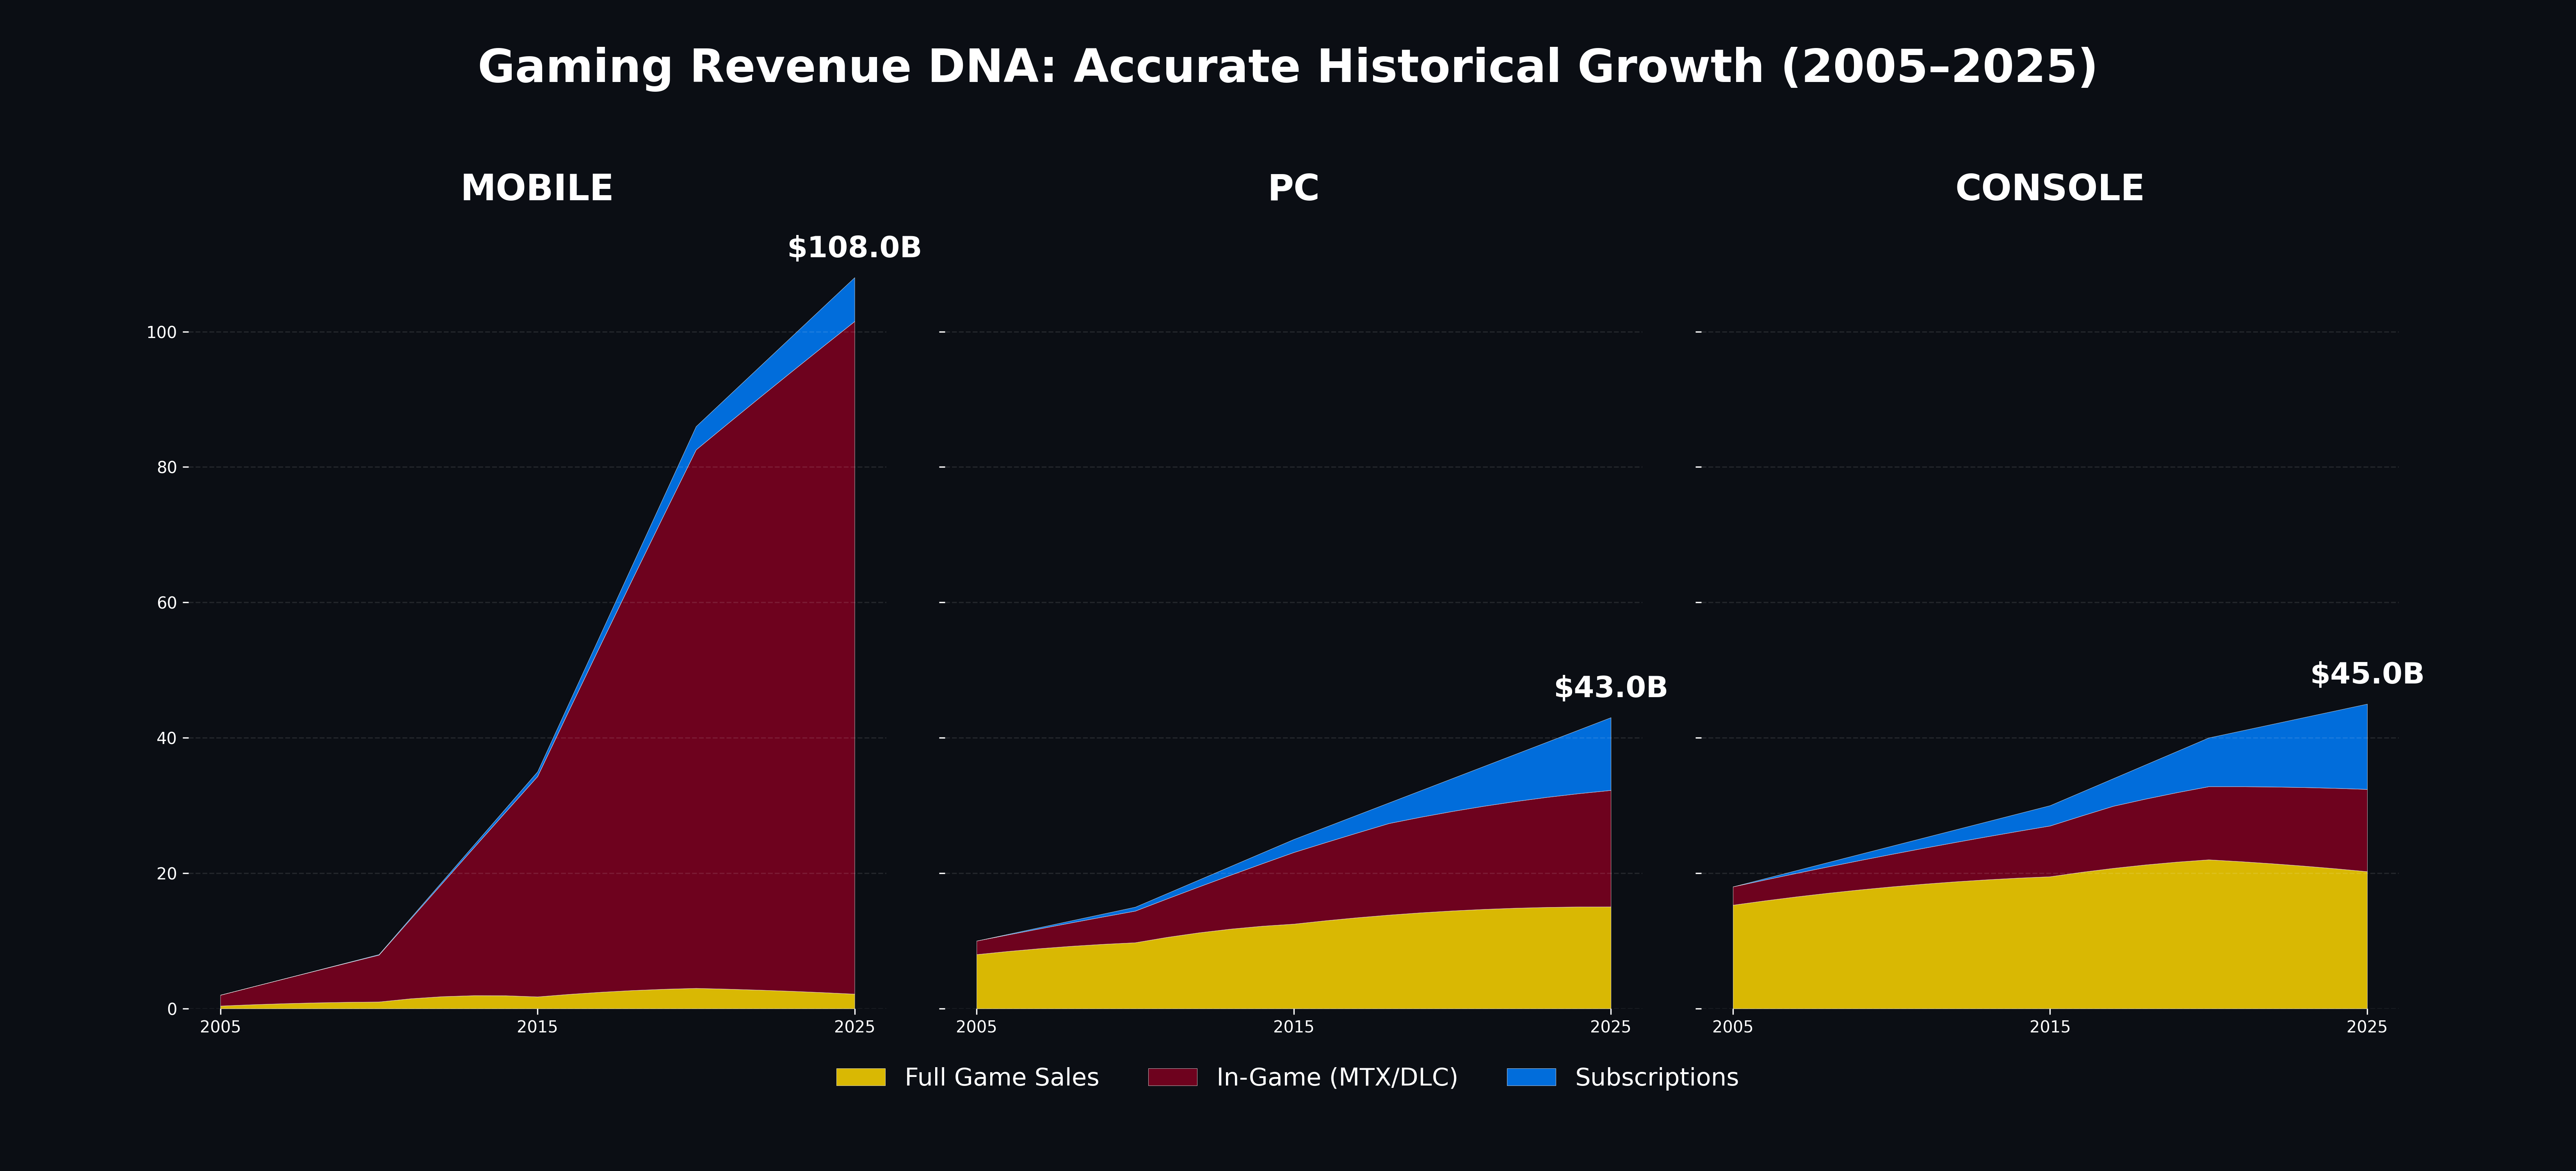
Following the feedback on my previous post, I’ve broken down the $197B global revenue by platform to show the distinct “DNA” of Mobile, PC, and Console gaming.
Data Sources: Synthesized and aggregated revenue data from Newzoo Global Games Market Reports (2012-2025), MIDiA Research, and Statista.
Latest Update: The $197B figure and the $108B mobile total reflect the revised December 2025 forecasts.
Growth Trends: PC segment growth of 10.4% YoY in 2025 is a key driver for this year’s record totals.
Definitions:
Full Game Sales (Premium): Revenue from physical and digital one-time purchases (e.g., $70 AAA titles, Indie games).
In-Game Purchases (MTX/DLC): Revenue from microtransactions, skins, loot boxes, and downloadable content.
Subscriptions: Revenue from multi-game services like Xbox Game Pass, PlayStation Plus, and MMO subscriptions.
Tools: Visualization performed using Python with pandas for data manipulation and matplotlib for the layout. I used scipy (specifically interp1d and spline interpolation) to ensure historical revenue transitions between 2005 and 2025 accurately reflect industry milestones while maintaining a clean aesthetic.
moldyolive on
also seems like console ia losing to pc
xanas263 on
Are battle passes considered subscriptions or MTX in this data? While not required to play a game they are structured like a subscription and some mobile games consider their Battle pass systems to be subscriptions from what I’ve seen.

3 Comments
[OC] Data Sources & Methodology
Following the feedback on my previous post, I’ve broken down the $197B global revenue by platform to show the distinct “DNA” of Mobile, PC, and Console gaming.
Data Sources: Synthesized and aggregated revenue data from Newzoo Global Games Market Reports (2012-2025), MIDiA Research, and Statista.
Latest Update: The $197B figure and the $108B mobile total reflect the revised December 2025 forecasts.
Growth Trends: PC segment growth of 10.4% YoY in 2025 is a key driver for this year’s record totals.
Definitions:
Full Game Sales (Premium): Revenue from physical and digital one-time purchases (e.g., $70 AAA titles, Indie games).
In-Game Purchases (MTX/DLC): Revenue from microtransactions, skins, loot boxes, and downloadable content.
Subscriptions: Revenue from multi-game services like Xbox Game Pass, PlayStation Plus, and MMO subscriptions.
Tools: Visualization performed using Python with pandas for data manipulation and matplotlib for the layout. I used scipy (specifically interp1d and spline interpolation) to ensure historical revenue transitions between 2005 and 2025 accurately reflect industry milestones while maintaining a clean aesthetic.
also seems like console ia losing to pc
Are battle passes considered subscriptions or MTX in this data? While not required to play a game they are structured like a subscription and some mobile games consider their Battle pass systems to be subscriptions from what I’ve seen.