
Hey all,
I submitted my Master's thesis in mathematics 3 days ago and realized early on that I wanted to track my progress. I mainly hoped that it would help me see the progress I was making, which, in the end, it definitely did!
The obvious measurement of progress to me is word count in the compiled document. This was pretty easy to do, since I was working with LaTeX, and there is a script for automatically counting stats on the document, so I integrated that into my compile pipeline. I created a GitHub repository for my thesis, so I just manually pasted the current word count into each commit message (for the most part; I sometimes skipped this when there was only formatting etc. being done).
I then wrote a jupyter notebook script using GitPythonand regex to extract the word counts and other information on my work habits. In the end, I got the below graphics, which I found pretty fun to look at. The work was very minimal, everyone can do that even without coding experience.
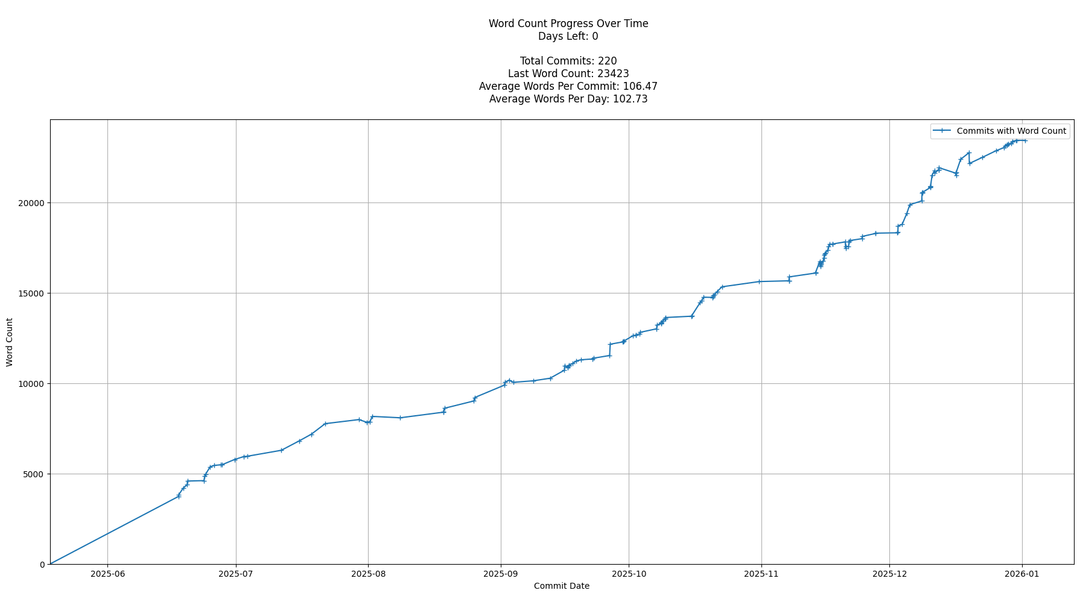
The most interesting thing to me is that the total word count graph (1st pic) is pretty linear, given that most people (including me) tend to procrastinate and then not sleep for the last 2 weeks before the deadline to get all the work done 😀
Here are the final stats produced by the texcount script:
Total
Words in text: 23423
Words in headers: 84
Words outside text (captions, etc.): 0
Number of headers: 18
Number of floats/tables/figures: 0
Number of math inlines: 3325
Number of math displayed: 347
Files: 114
by Ra77oR
1 Comment
I would suggest converting the line graph to a step chart! Cool data though