
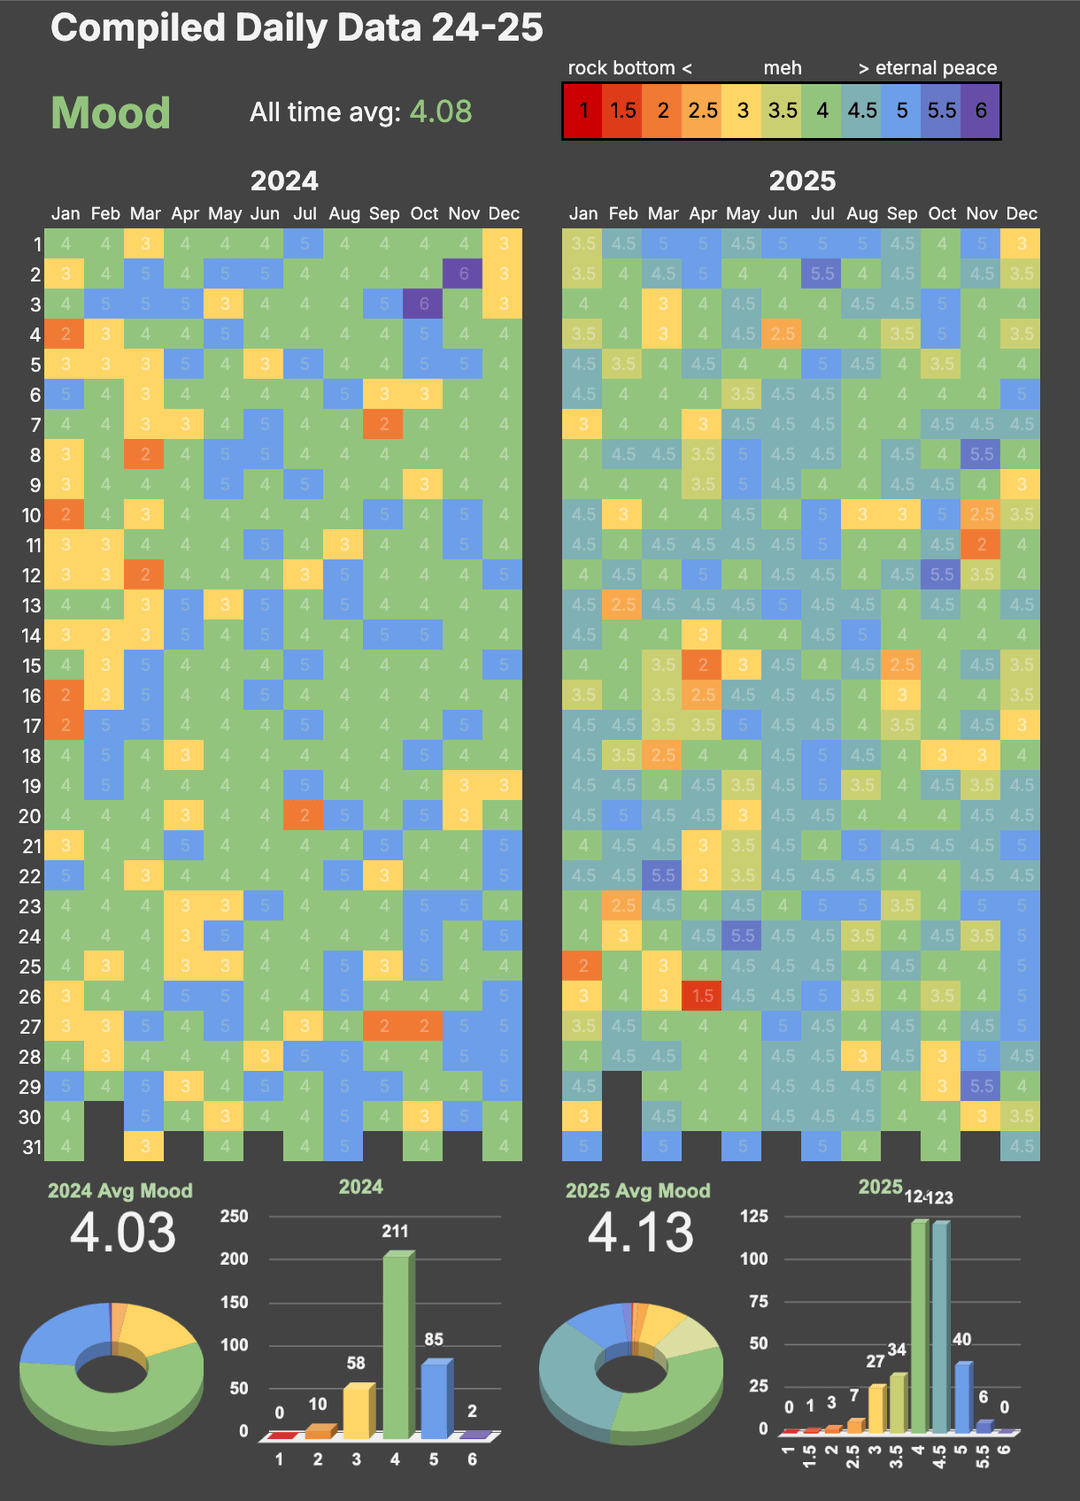

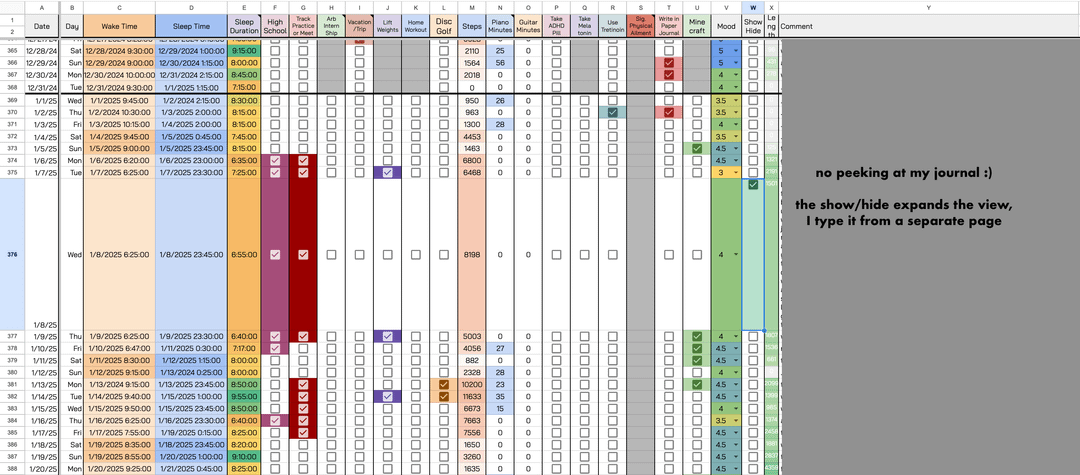
Google Sheets. I added half-steps to my mood rating scale of 1-6 at the end of 2024 because I wanted to be more precise. The increase in average mood from 24-25 is partly due to this, to me my true mood is more accurately reflected in 2025. I spent a lot of time making my dashboard look good. I enter everything manually on the data page (last image), and keep a digital journal built in as well. The histogram intervals are manual, they don't use the built-in histogram functionality. The greyed out columns are for missing data when I started tracking a new metric. Sometimes I can get data from the past from my journal, depends on the nature of the metric. If you couldn't tell I'm a senior in high school. Happy to answer any questions.
by Narf1107
1 Comment
Same! I’m in my first year of college now and I’ve done it for 5 years 🙂