
For the past (almost) 3 years, I've been tracking my mood daily. I recently decided to visualize this data alongside my dog Mikey's seizure records. For reference, I'm a pretty anxious person, and my mood is often attributed to how anxious I am. The seizures make me pretty anxious to witness and expect over the course of the month, so I feel like I'm often on edge.
The Data:
- 1044 days of mood tracking (Feb 2023 – present)
- 5 mood levels: Awful, Bad, Meh, Good, Rad
- 32 seizure events documented
- Special life events: Relationship milestones, birthdays
Visualizations (in order):
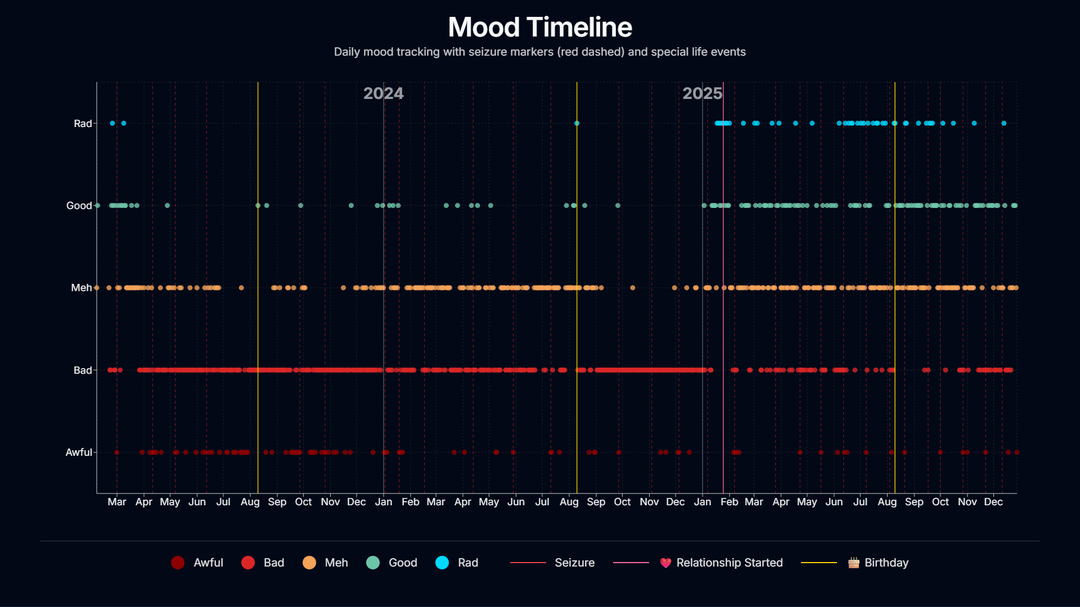
1. Daily Mood Timeline – Every single day plotted with color-coded mood levels. Red dashed lines show seizure events. Colored vertical lines mark major life moments like the start of my relationship (pink) and birthdays (gold).
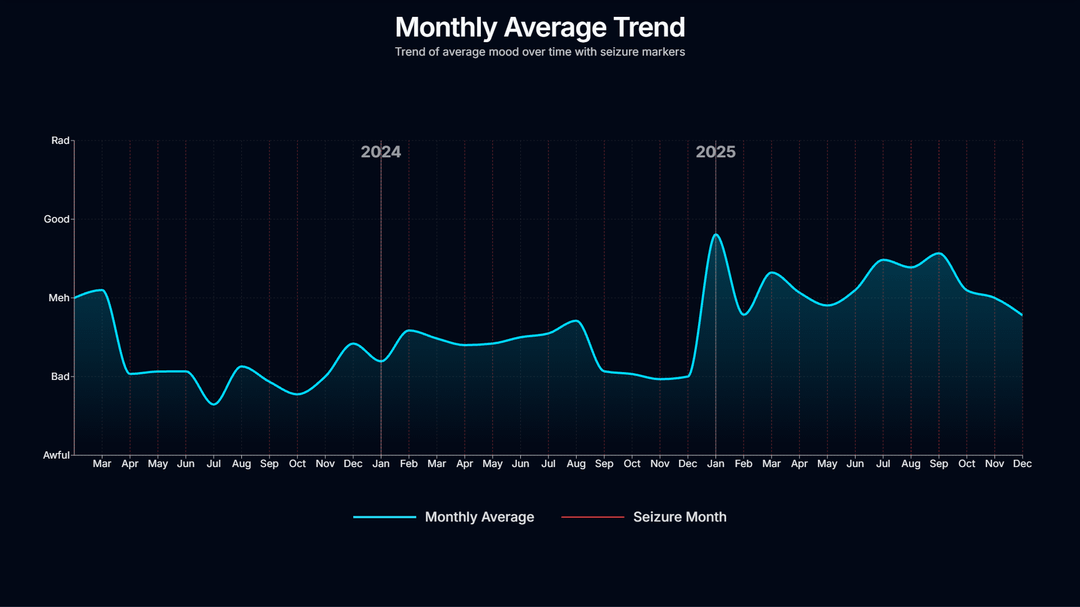
2. Monthly Average Trend – Rolling average of my mood over time, with seizure months marked in red. You can see the 2024 and 2025 year markers. The trend shows clear patterns during stressful periods.
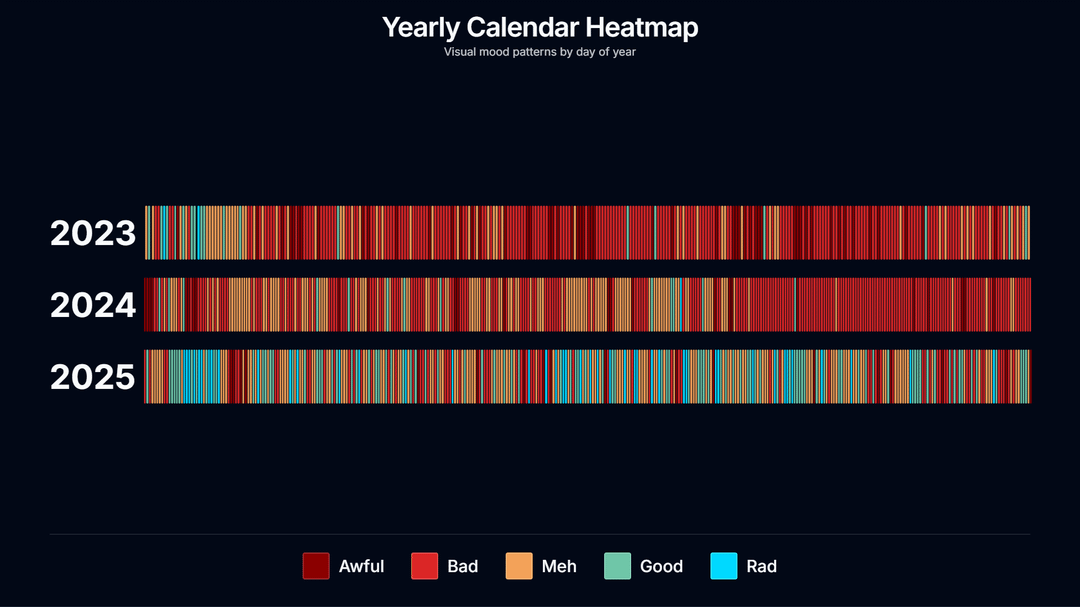
3. Yearly Calendar Heatmap – Each year displayed as a horizontal strip where every pixel is one day of data. Dark reds are awful days, bright cyans are rad days. Clearly 2023 and 2024 were awful years for my mood lol.
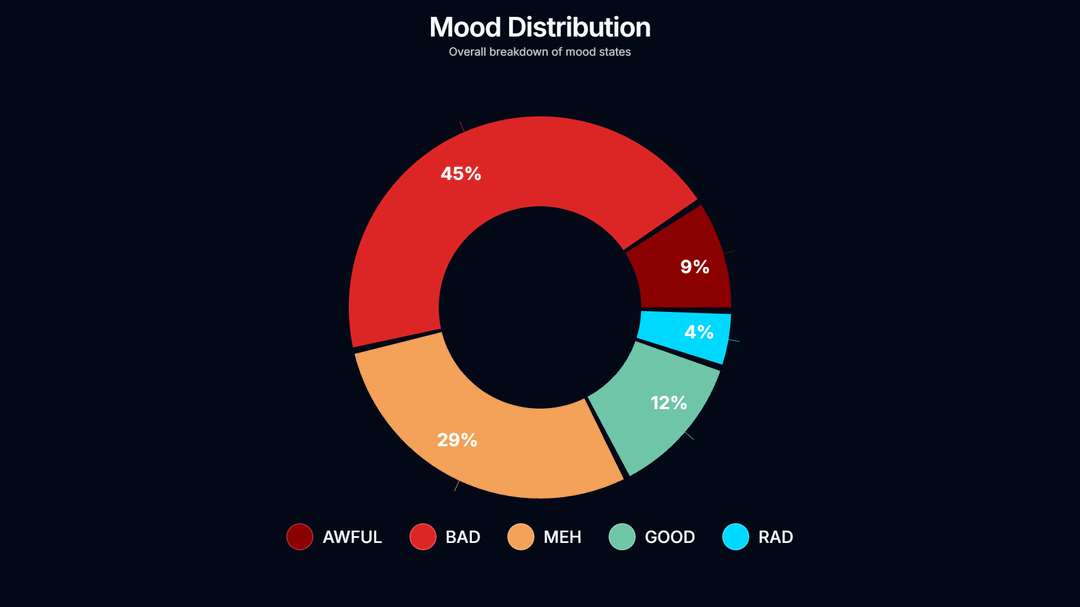
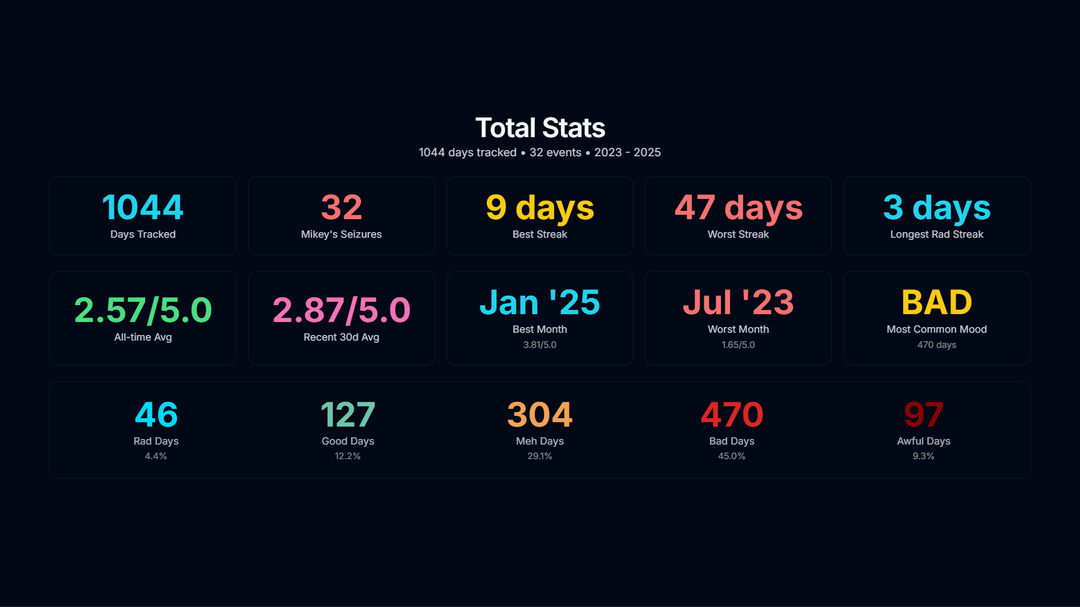
4. Mood Distribution – 4% rad, 12% good, 29% meh, 45% bad, 9% awful
5. Key Stats – 1044 total days tracked, 32 seizure events, best streak of 9 consecutive good/rad days, worst streak of 47 bad days, longest pure "rad" streak of only 3 days. Seeing myself go from 3 whole "rad" days in a year and a half to 43 in 2025 alone, after getting into a loving relationship, feels good to see.
Key observations:
- The correlation between stressful periods and seizure events was clearer than I expected
- Getting into a (healthy) relationship showed an immediate and sustained mood improvement
- After every seizure, there's a predictable dip that over time has been less apparent. I feel like I've gotten more used to the seizures and they haven't ruined my anxiety as much. It sounds really sad to say I've gotten used to them, but Mikey is on medication, we've tried multiple and I think I've just gone through radical acceptance that I'm doing everything I can for him, even if that's meant they are still happening while medicated 😔
Why I track: Seeing the patterns helps me be more compassionate with myself during the rough weeks. I know I have more bad days than good, but visually seeing how certain events affected me over time has been really interesting.
by KINOtheproducer
3 Comments
**Tools Used:**
Mood tracking: Daylio (exported to CSV)
Seizure Tracking: Google Sheets (exported to CSV)
Graphs: Custom coded dashboard I made in Next.js using Shadcn UI elements
If you wanted to more clearly visualize the impact of the seizures on your mood, I’d show it as a bar chart with the distribution of the different mood values, with one color reserved for the days immediately prior to the seizure and the other showing days on/immediately after the seizure. You could similarly visualize the distribution before and after your relationship started, since as you say it’s pretty obvious that your mood shifted to be a lot more positive on average after that.
I cannot see where the seizures are on the first chart? I only see one line that is not a birthday and I’m assuming it’s the relationship starting.