
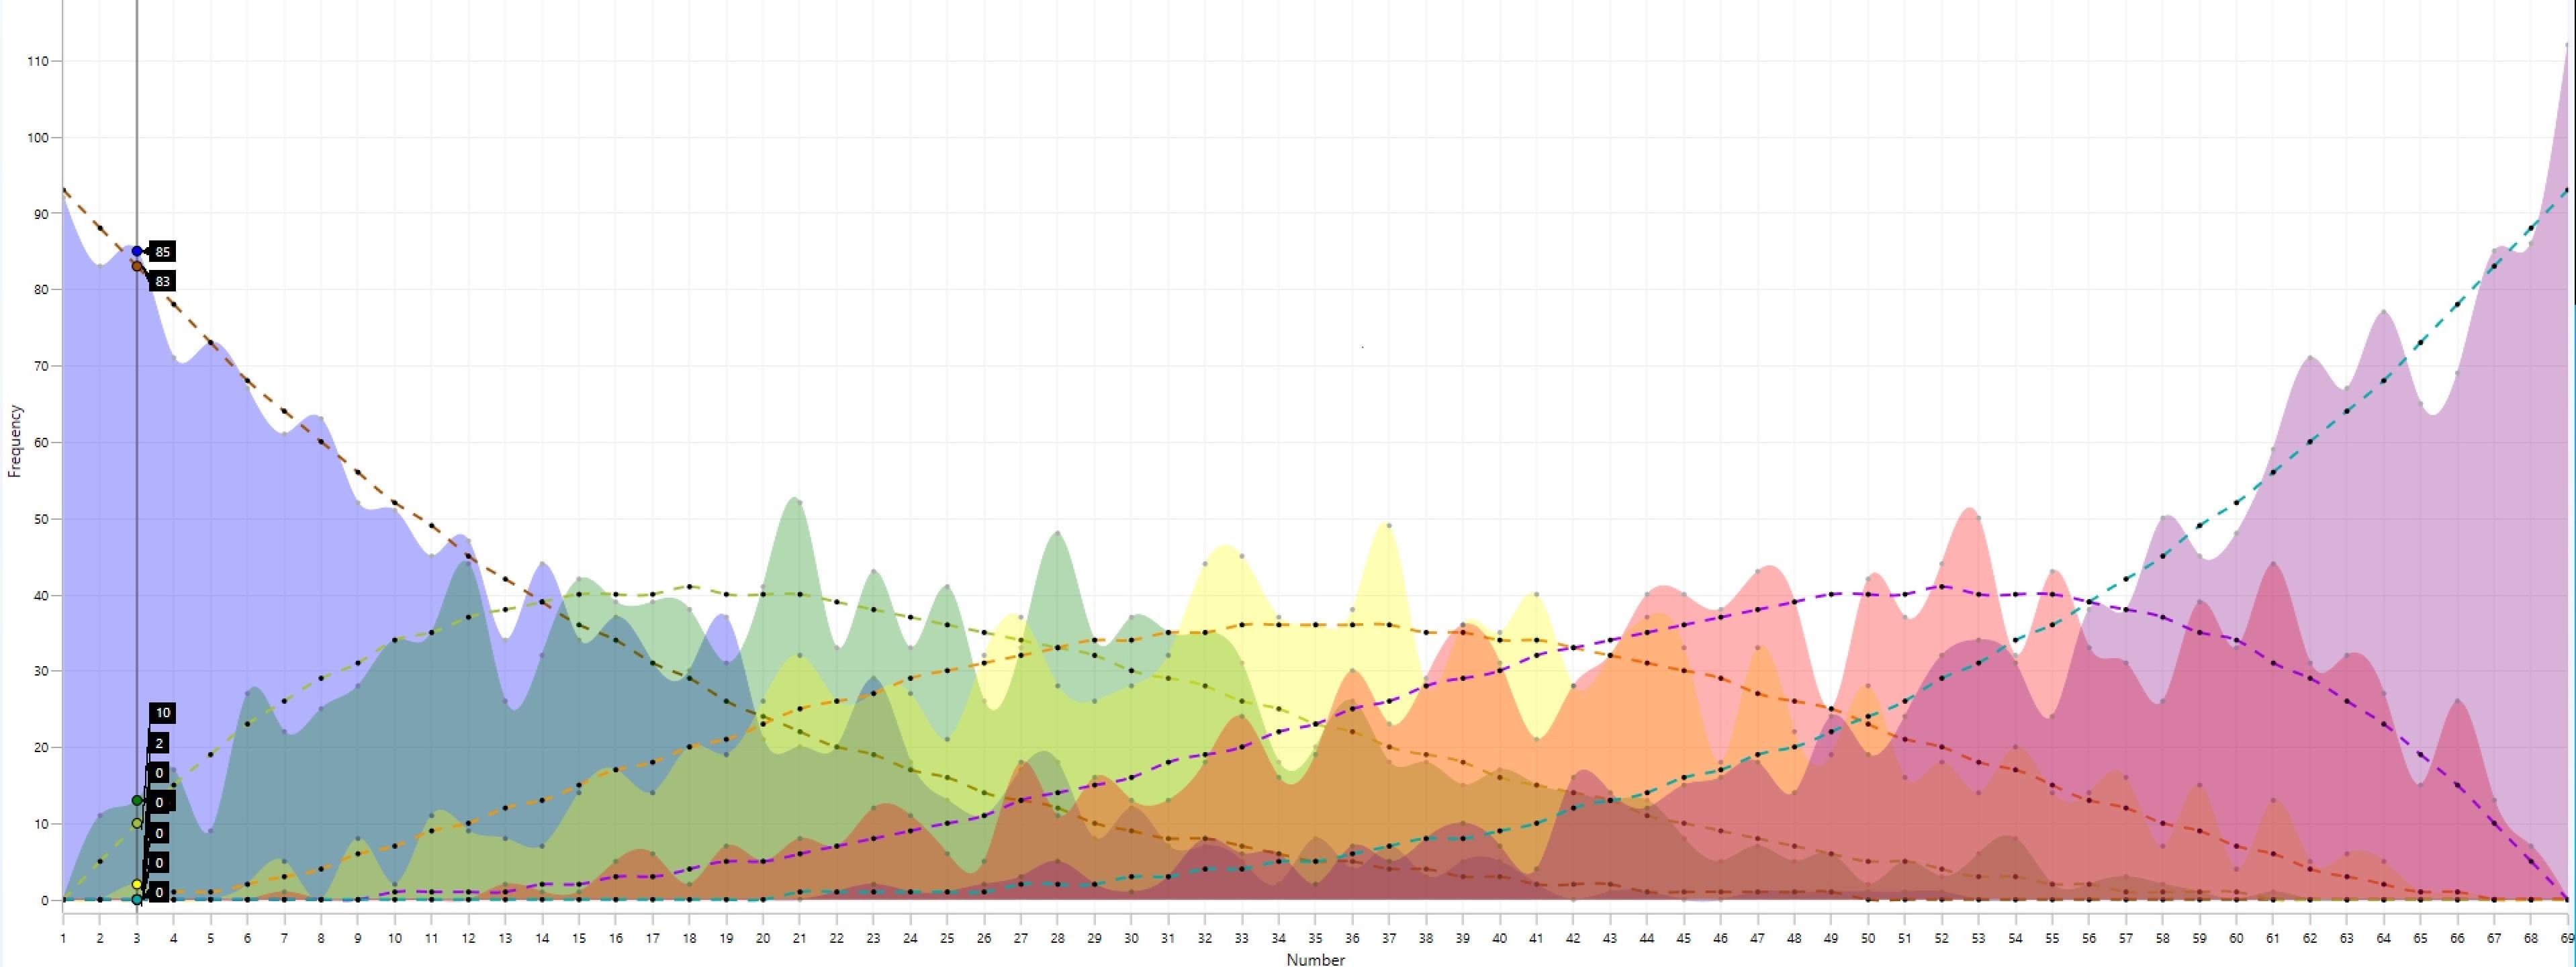
OC. For each Powerball draw, I sort the 5 white balls (1–69) in ascending order and treat them as order statistics:
Ball 1 = smallest number in the draw, …, Ball 5 = largest number in the draw.
The colored curves show the observed counts of how often each number (x) became the (k)-th sorted ball across N = 1287 draws.
The dashed gray curve is the theoretical expectation under a fair “5 out of 69” model, computed exactly as:
[ \mathbb{E}[\text{hits at }x] = N \cdot \frac{\binom{x-1}{k-1}\binom{69-x}{5-k}}{\binom{69}{5}} ]
So peaks are numbers that were the (k)-th sorted ball more often than expected, and troughs are less often than expected—the “wave” is just sampling variation around the expectation.
Important: this is descriptive only and doesn’t provide a way to predict future draws; each draw is independent (a good reminder against gambler’s fallacy).
(White balls only; the red Powerball is excluded.)
by Pure-Cycle7176