Tool used: Moodistory ([https://moodistory.com](https://moodistory.com)) (@mods: I’m the dev of this app. The image is created using the share button within the app.)
Data source: My mood
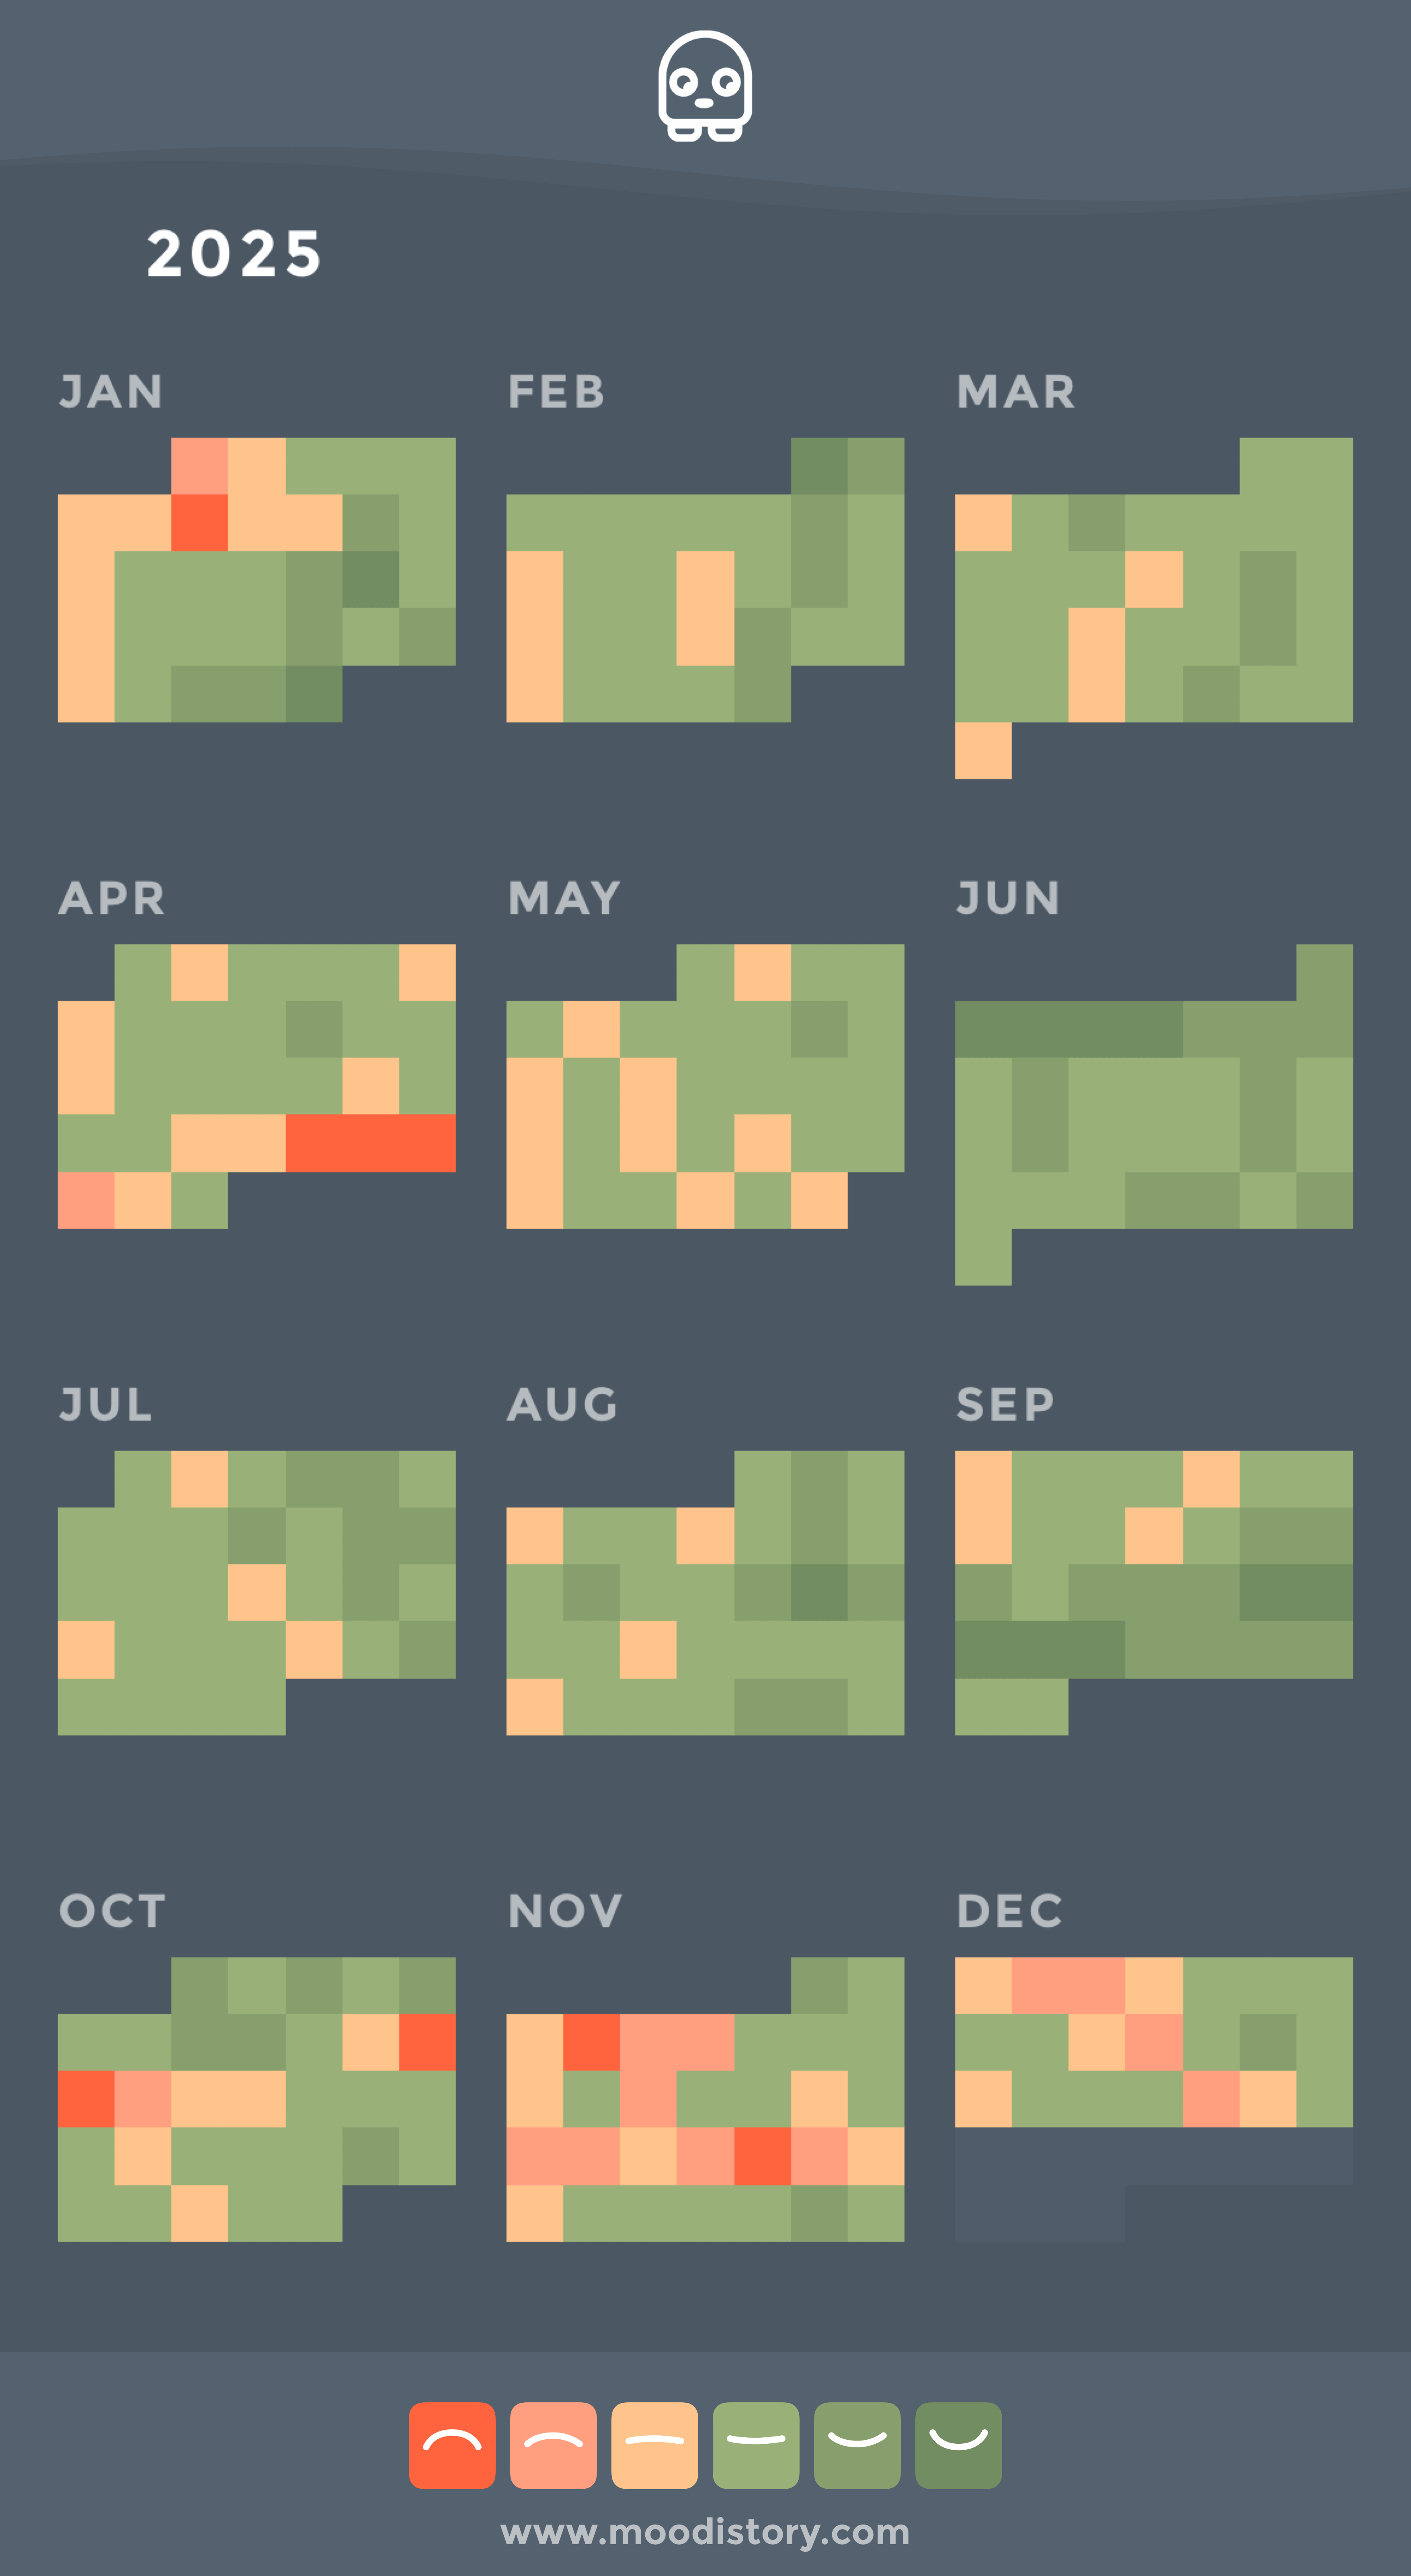
Chart notes: This chart is a variant of the year-in-pixels chart. Every square represents my average mood of the day. I personally love this chart because it shows at one glace how my year went AND looks nice.
A note to those with color blindness: I’ve created this chart in a color-blind-friendly version here:

5 Comments
Tool used: Moodistory ([https://moodistory.com](https://moodistory.com)) (@mods: I’m the dev of this app. The image is created using the share button within the app.)
Data source: My mood
Chart notes: This chart is a variant of the year-in-pixels chart. Every square represents my average mood of the day. I personally love this chart because it shows at one glace how my year went AND looks nice.
A note to those with color blindness: I’ve created this chart in a color-blind-friendly version here:
[https://imgur.com/a/f11Fhs1](https://imgur.com/a/f11Fhs1)
I wasn’t nearly as happy as you seem to be
https://preview.redd.it/ulwf03h4yq8g1.png?width=3960&format=png&auto=webp&s=19fa42cf2159eb2379860b220e9bc1209aaa824e
I guess your life could use more sun during the winter 🙂
I think you’re overestimating the informative value of a pacman ghost.
You love summer, Mondays not so much.