
Hi everyone!
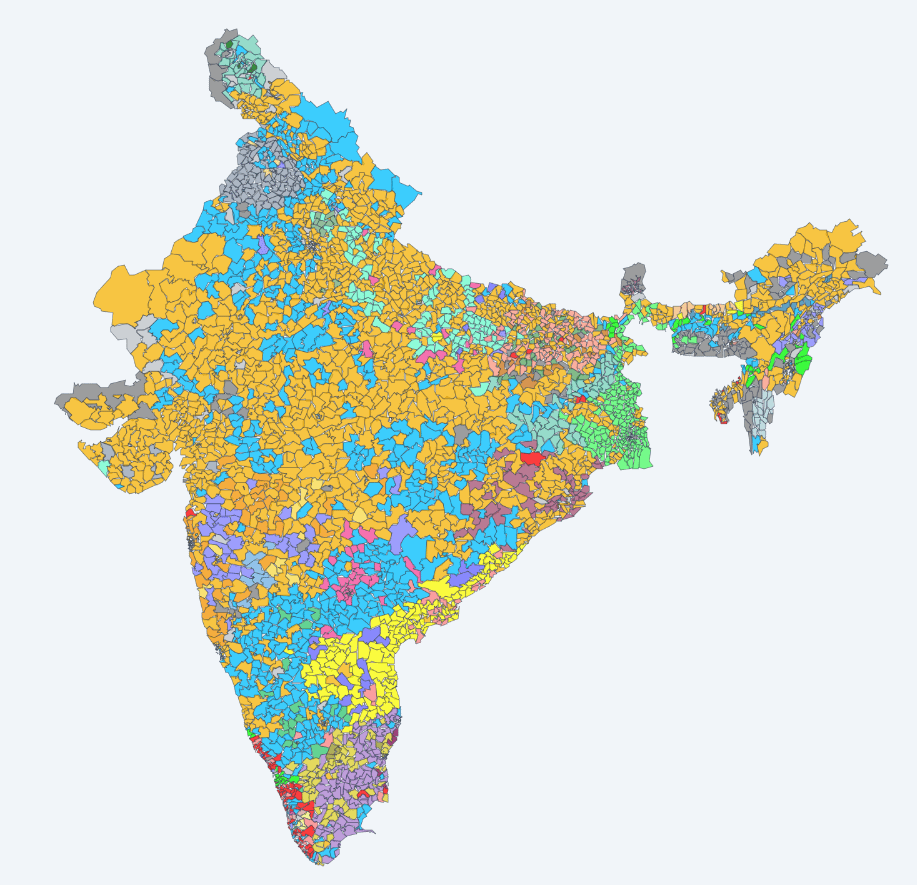
I’ve been working on a project to make Indian election data more accessible and visual. It’s an interactive map of India’s Legislative Assembly constituencies that lets you dive much deeper than just who won where.
What you can do with it:
- Filter by just about anything: Want to see where younger MLAs won? Or where the victory margin was less than 1%? You can filter by Age, Gender, Category, Turnout, and Victory Margin.
- State-specific views: Zoom into any state to see the local landscape.
- Performance maps: See color-coded visuals for different parties to understand their true footprint.
- Share your view: If you find an interesting stat (like "Women candidates' performance in Karnataka"), you can just copy the URL and share it.
Check it out here: https://garudadevdataservices.github.io/indian_mlas/
I’d love to hear your feedback or if you find any interesting insights using the filters!
by CommenderPaul
1 Comment
To make this Website
– I have extracted the data from [https://www.eci.gov.in/statistical-reports](https://www.eci.gov.in/statistical-reports)
– I have used leaflet, react primarily to make this website