
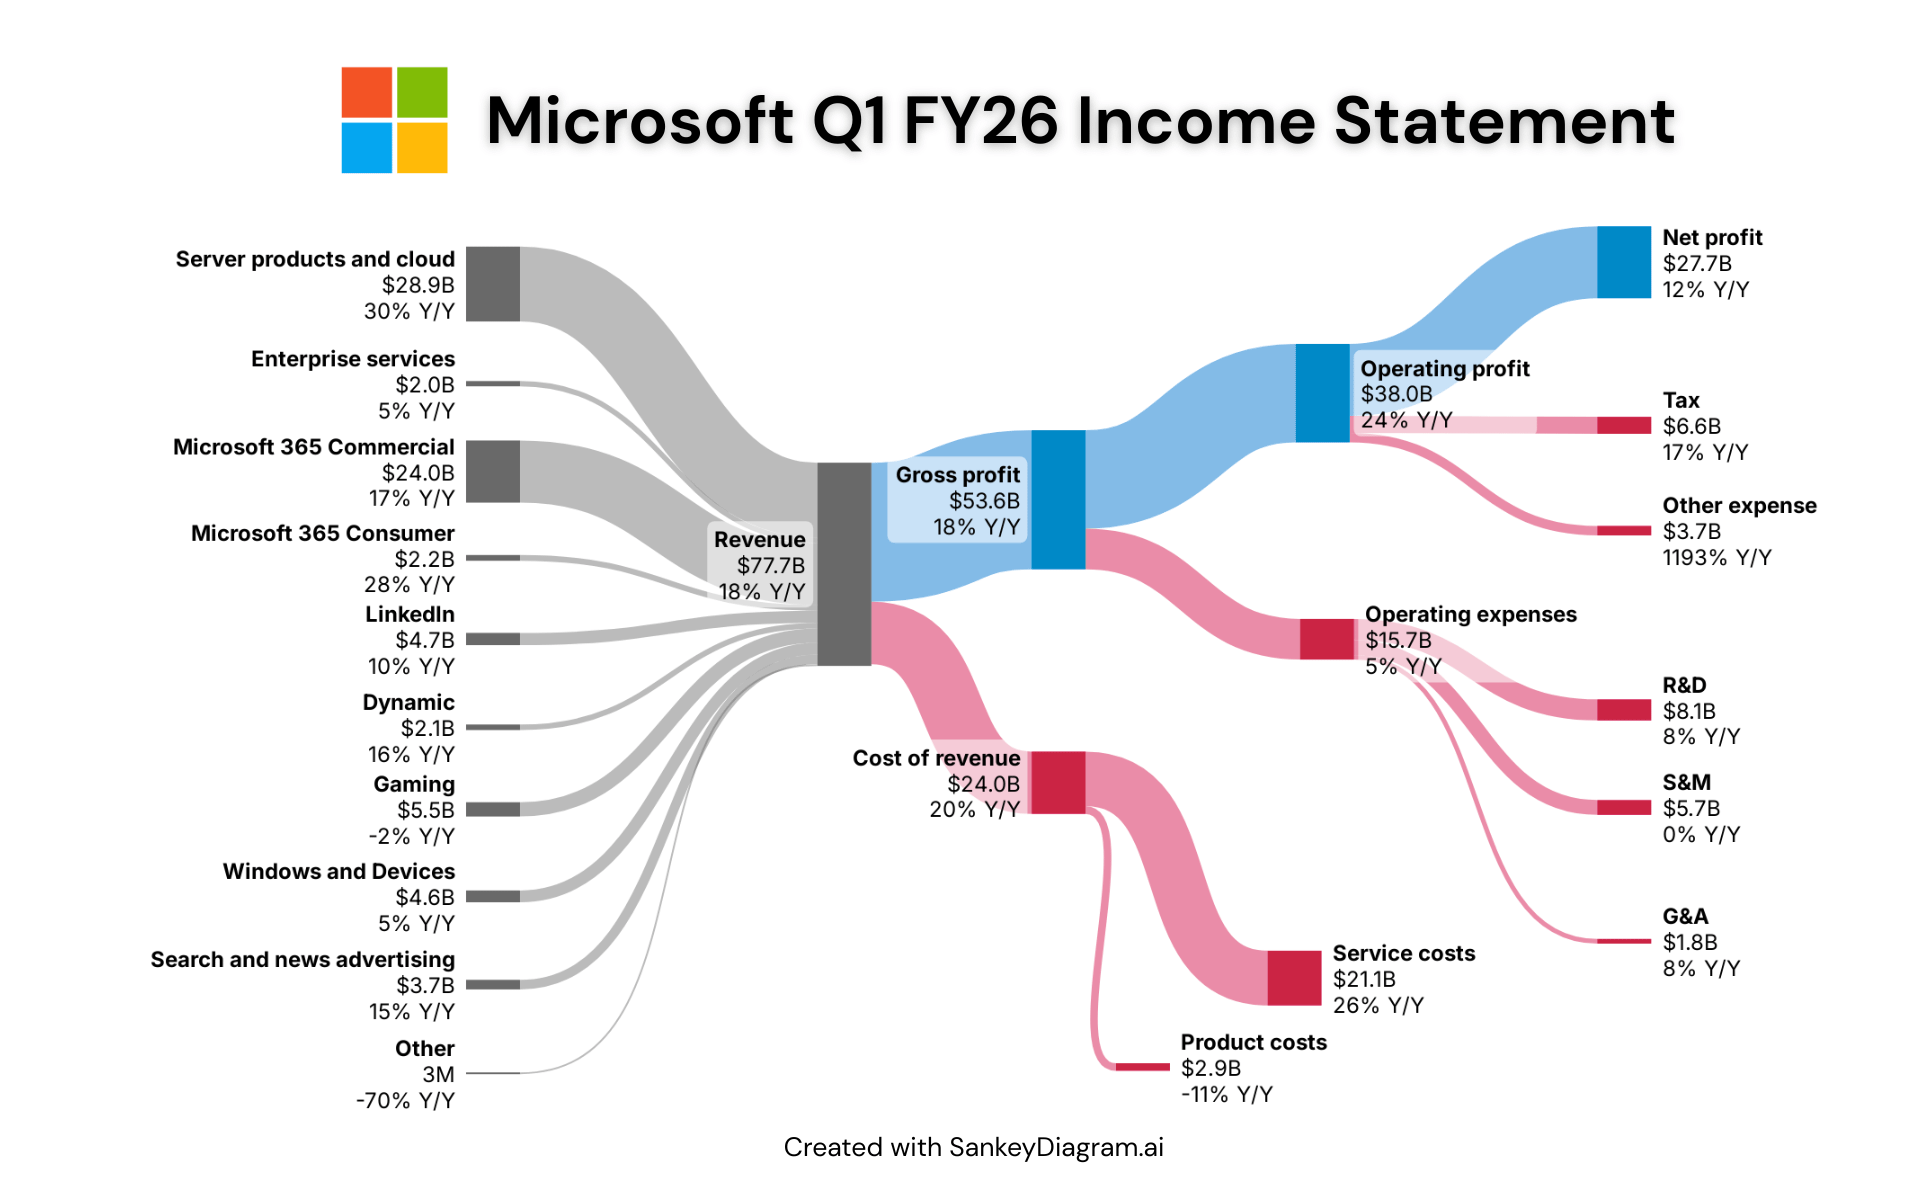
This Sankey diagram visualizes Microsoft’s Q1 FY26 income statement, showing how the company generated $77.7B in total revenue and how it flowed through costs and operating expenses to produce $27.7B in net profit.
Highlights from Q1 FY26:
- Server products and cloud services remain the largest revenue driver, growing 30% year over year
- Microsoft 365 Commercial and LinkedIn continue steady growth
- Gross profit reached $53.6B, up 18% YoY
- Operating profit increased to $38.0B, up 24% YoY
- Net profit rose 12% YoY, despite higher operating expenses
Made with: SankeyDiagram + Canva Tool
Source: Microsoft Q1 FY26 Earnings Report / Investor Relations
by FrostingTall9171
2 Comments
Which one shows how much Altman siphoned?
Weird how AI isn’t listed? I’d assume, given how important and awesome everyone says it is, that they would want is to know how much money it is making them.