
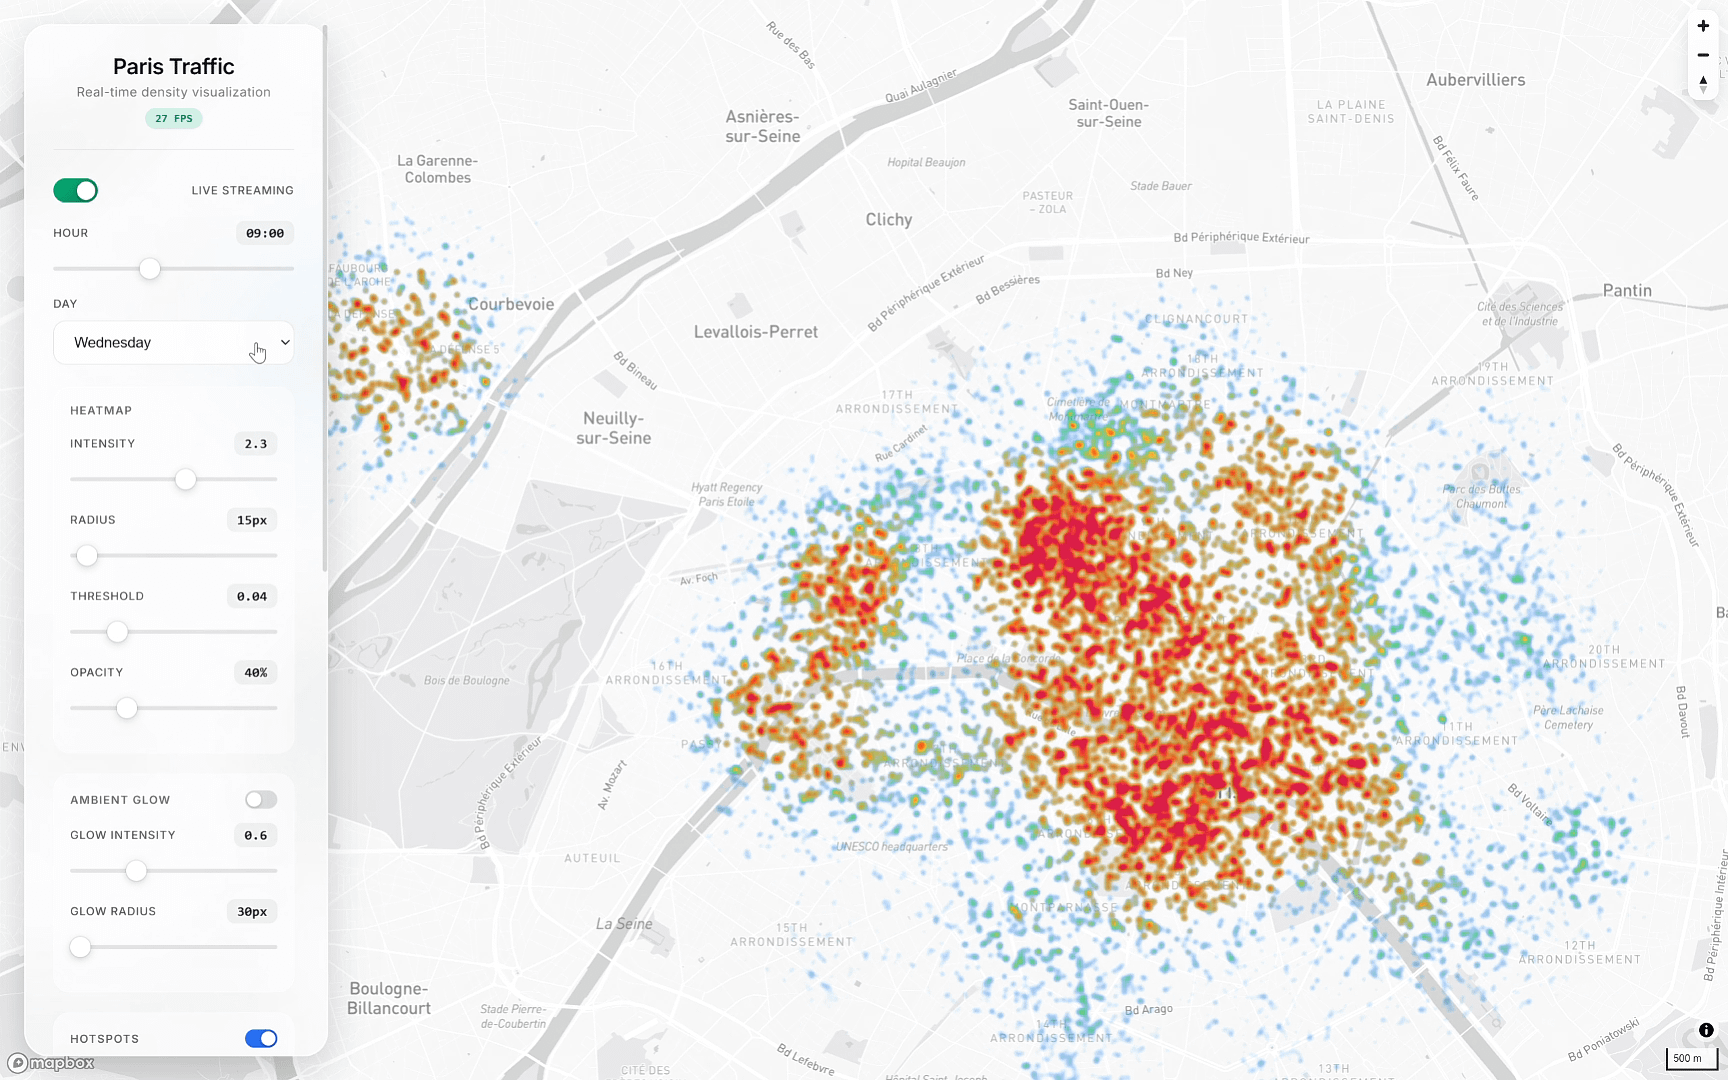
Data Source: Simulated data based on 50+ key urban hotspots in Paris (Eiffel Tower, La Defense, Sacre-Coeur, major train stations, business districts) with 168 unique temporal profiles (24h x 7 days).
Tools Used:
– Uber H3 hexagonal spatial indexing for geographic discretization
– Probabilistic density modeling engine (custom-built)
– Gaussian Interpolation for smooth gradient visualization
– Node.js for backend probability calculations
– DeckGL with WebGL shaders for rendering 17,000+ dynamic points in real-time
– GPU acceleration for computational performance
Methodology:
Each hotspot has temporal activity patterns that vary by hour and day of week. The simulation models how urban density shifts across Paris's 105km² throughout a complete weekly cycle, using exponential decay for influence propagation from each source point.
GitHub repository available in comments.
by Glass-Caterpillar-70
2 Comments
GitHub Repo (process and explanation there) :
[https://github.com/yvann-ba/realtime-paris-density-simulation.git](https://github.com/yvann-ba/realtime-paris-density-simulation.git)
btw i’m building a BIGG geospatial/AI project with my father :
it’s a planetary-scale architecture with real earth data, where you can interact with everything like a video game (drive vehicles, add/edit roads & trees) All in Real-Time
Basically Google Earth + Minecraft = our project
would love feedbacks/advices on our project, just send me a dm on linkedin if you’re up to share XP pleasee ((:
[https://www.linkedin.com/in/yvann-barbot/](https://www.linkedin.com/in/yvann-barbot/)
Those are certainly all words.
Can you explain this in a more simple manner?