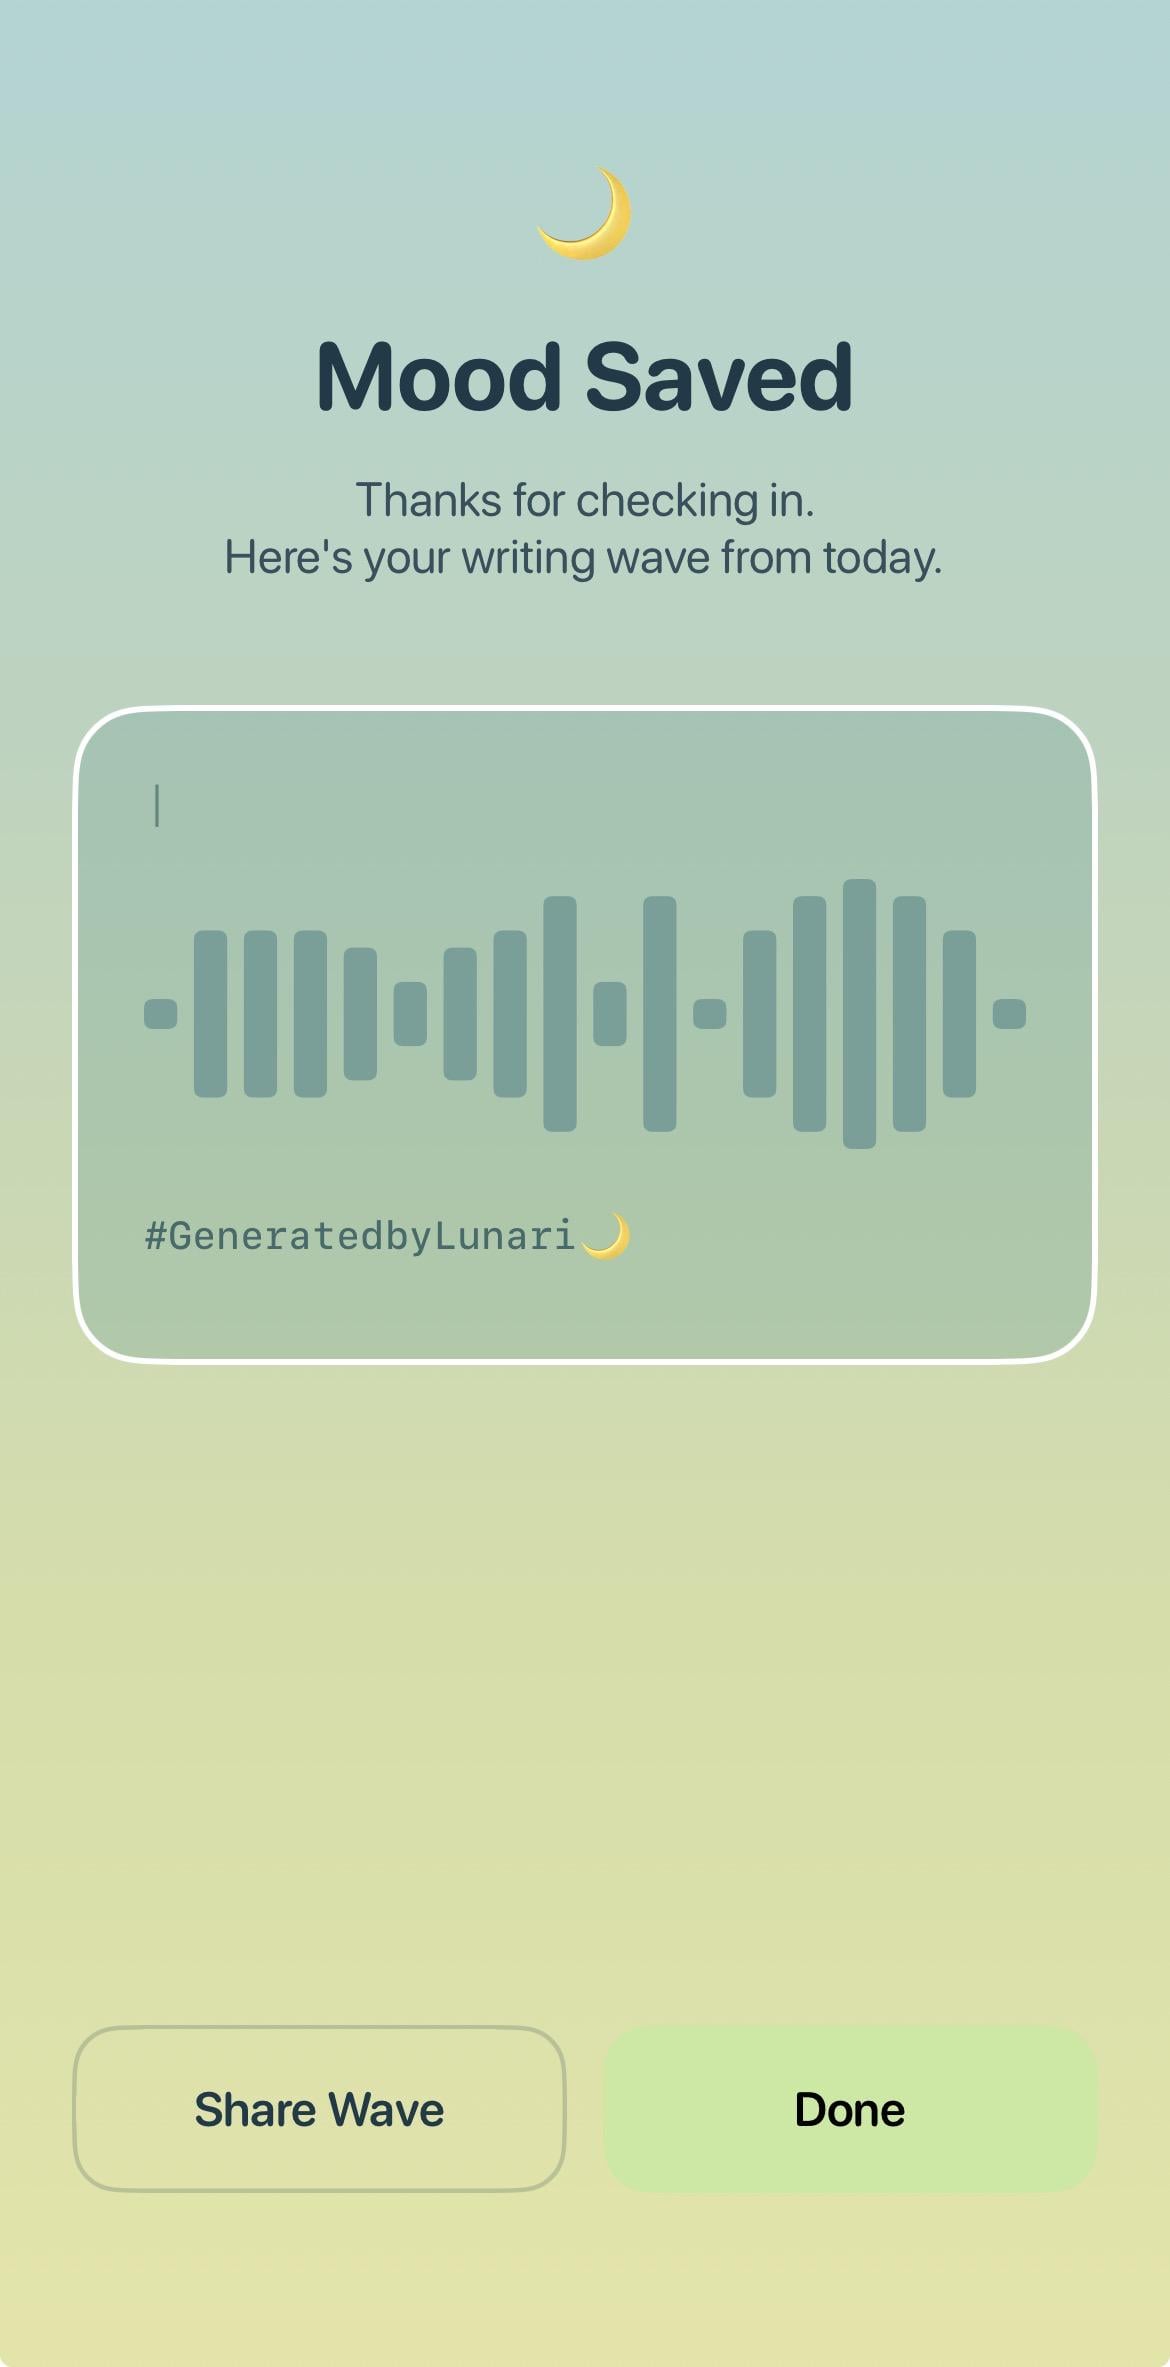
This visualization demonstrates a waveform generated from simulated text input over time. The waveform represents variations in input intensity and pauses, showing how non-linear writing activity can be mapped into a continuous signal.
by StrictAnalyst160

1 Comment
Data source:
Synthetic text input generated to simulate writing behavior over time. No real user text or behavioral data was used.
Method:
Simulated text activity was converted into a continuous signal based on character frequency and temporal gaps between inputs. The signal was then rendered as a waveform to reflect writing rhythm rather than semantic content.
Tools:
App
Notes:
This visualization was created as an experiment in representing non-linear text activity visually rather than as traditional text blocks.