


Updated data, all critiques welcome
Original data:
https://www.kaggle.com/datasets/darrenlang/all-movies-earning-100m-domestically
by Darren_has_hobbies
Updated data, all critiques welcome
Original data:
https://www.kaggle.com/datasets/darrenlang/all-movies-earning-100m-domestically
by Darren_has_hobbies
4 Comments
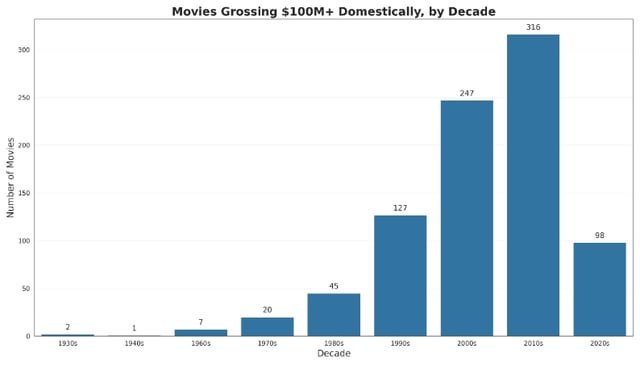
Is the total volume of movies down in 2020s? Is it being skewed by streaming services?
This raises an interesting question: Adjusted for inflation, has anything topped Gone with the Wind yet? I know it still had the record as recently as the 2000’s.
I don’t understand what the second chart is supposed to be based on. It’s titled “median domestic gross of Top 10 films”, but the bars for each decade all have a different *n*, and for three of the decades *n* is less than 10…?
The third chart has the dates in reverse order, for some reason.
It also looks like you’re truncating your data set in a counter-intuitive way. I’m guessing you’ve taken $100 million as the cutoff in each year’s dollars and set that as your threshold for inclusion, and then converted the values to 2024 dollars? (Which would seem to explain why you’ve got $100-million-grossing films in the 2020s, but only billion-grossing films in the 1930s and 40s.)
That third graph definitely catches my eye the most. A couple observations:
1. We haven’t had a big blockbuster this decade yet.
2. A modern movie would have to gross over $2B to topple Gone with the Wind
3. Inflation adjusted revenue gets lower every decade.
4. I can guess at some of the high earners just by the placement of the dots. Highest dot on the 90’s is Titanic, and I would’ve assumed Avatar for the 2000’s, but given it’s placement on the x axis, I’m wondering if it’s Finding Nemo.