
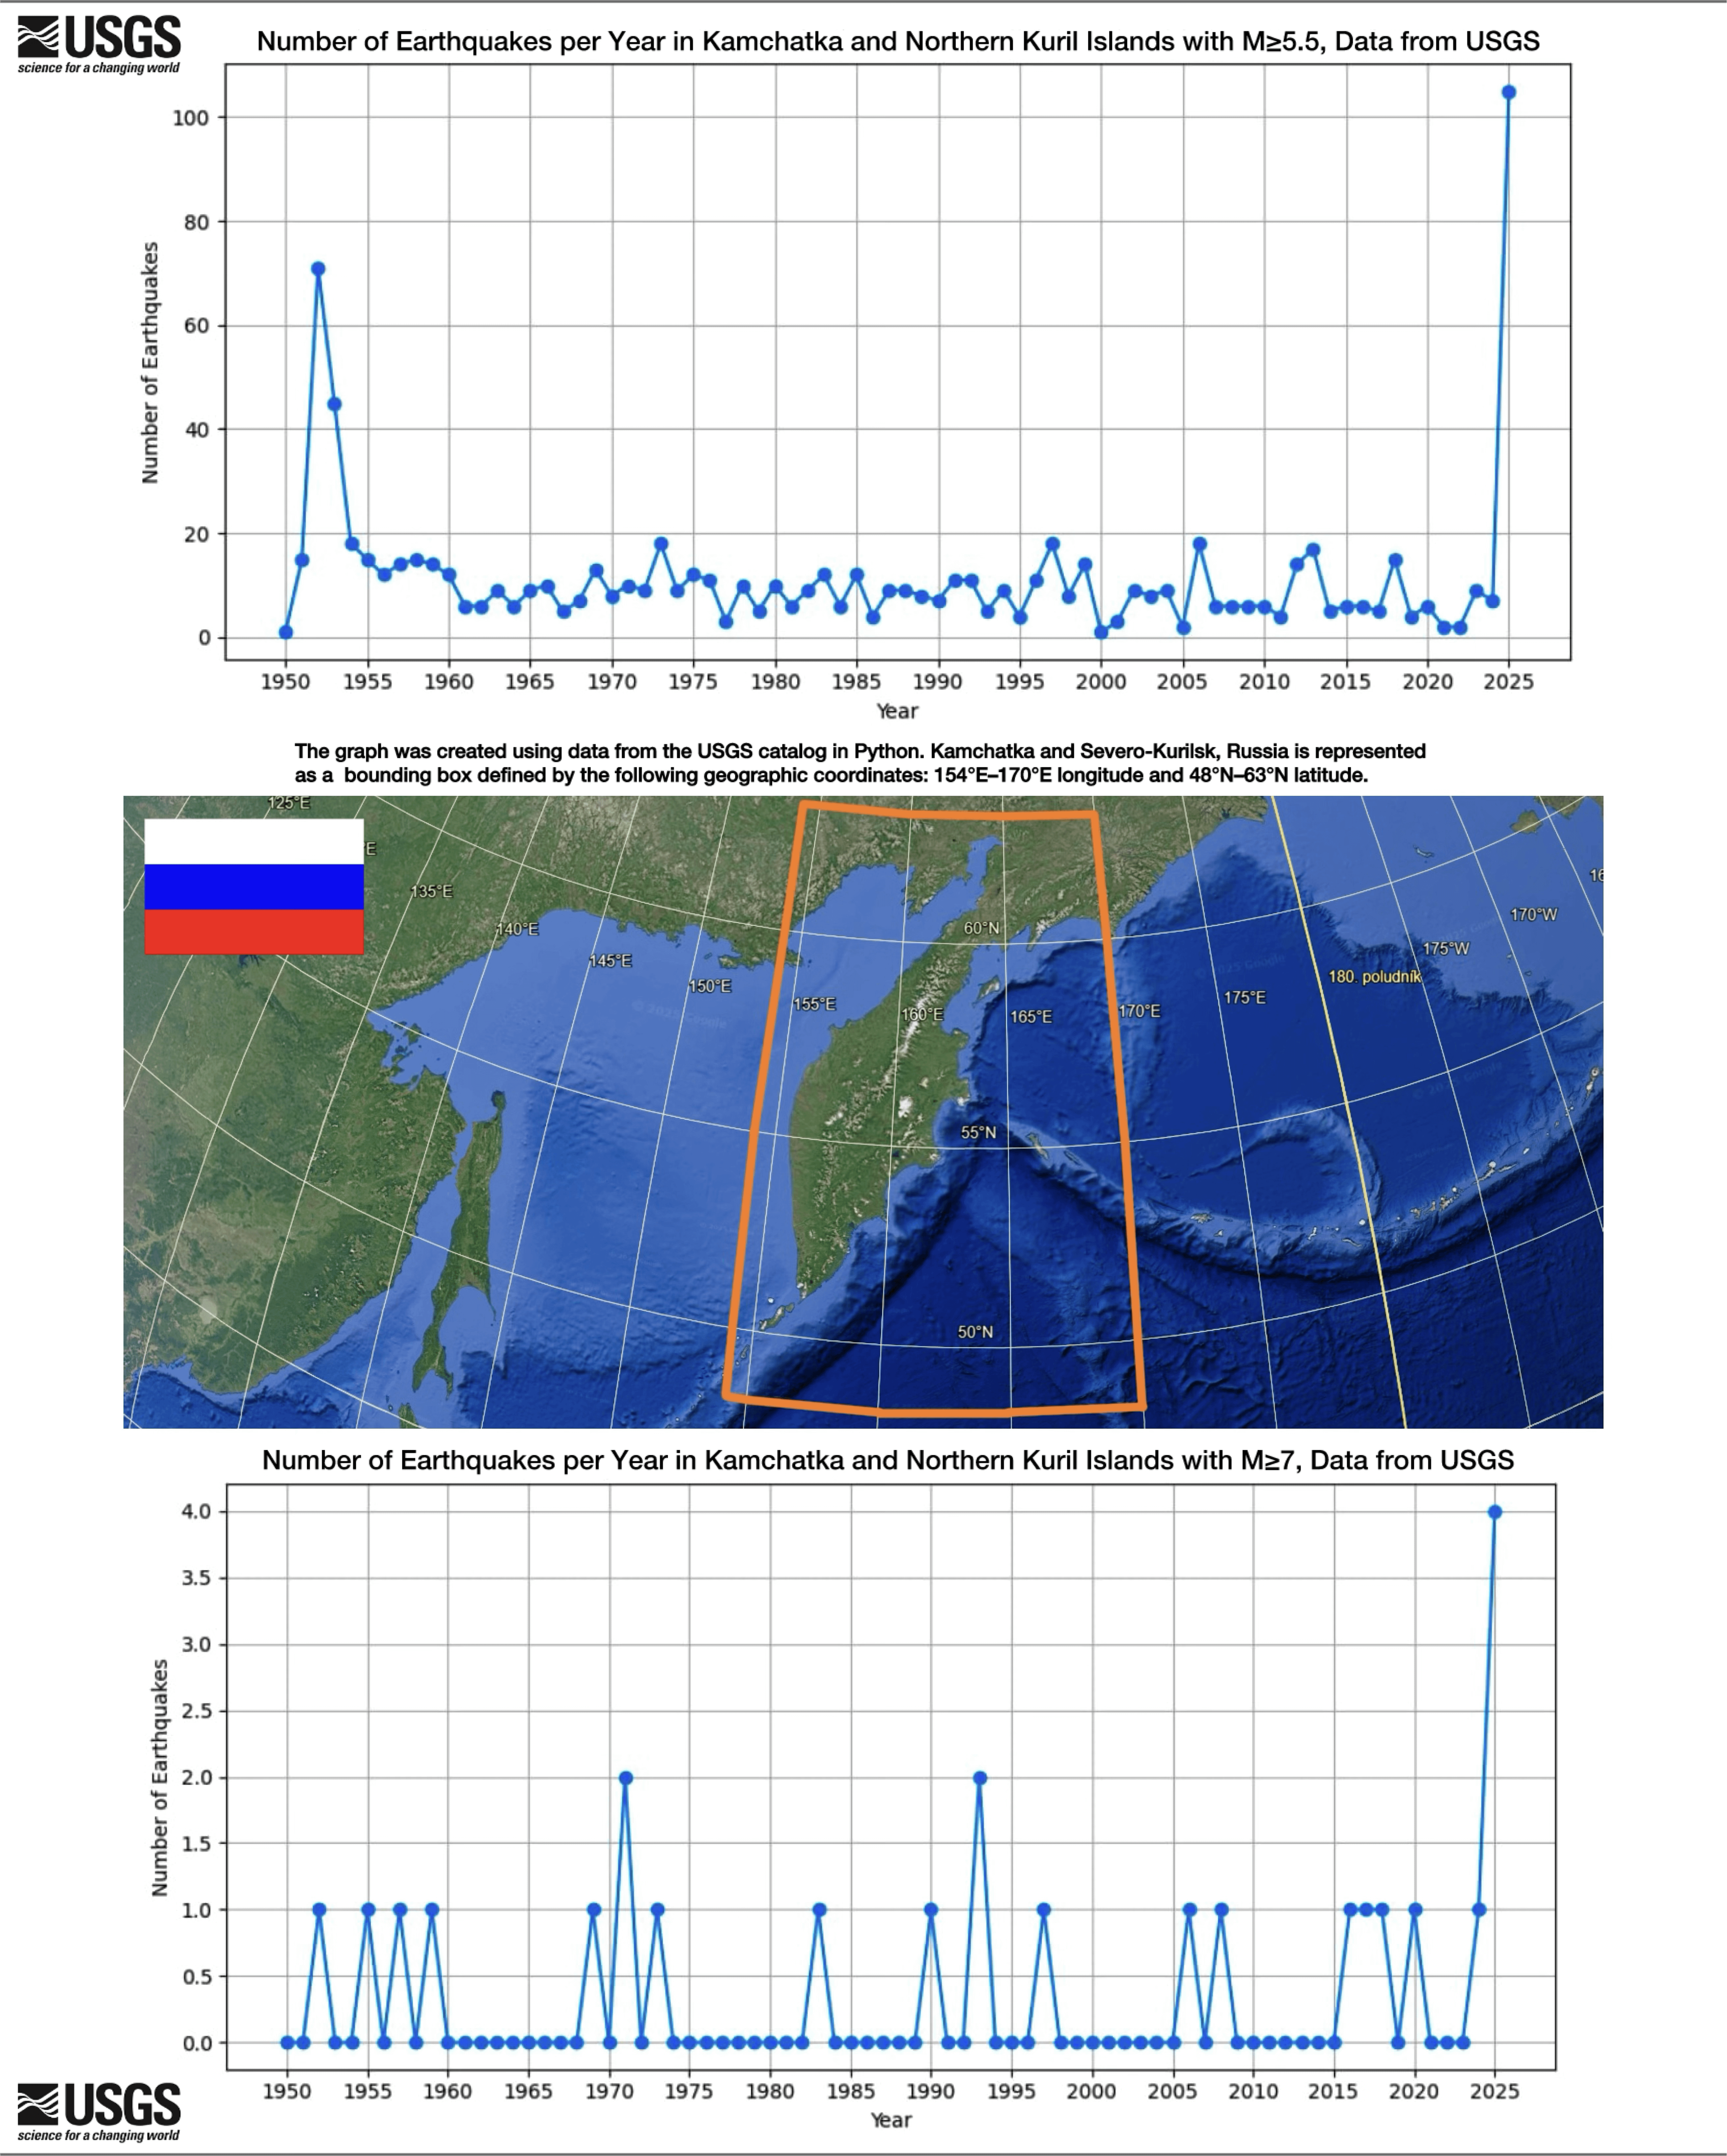
This visualization compares the aftershock behavior of the two largest megathrust earthquakes that occurred in the same Kamchatka subduction zone region.
The first chart shows the number of earthquakes with magnitude ≥5.5 from 1950 onward, highlighting aftershock sequences following the 1952 M9.0 and the 2025 M8.8 earthquakes. Despite being slightly smaller in magnitude, the 2025 event produced a higher number of M5.5+ aftershocks within the first three months.
The second chart shows the occurrence of earthquakes with magnitude ≥7 associated with each sequence. The 2025 megathrust generated multiple M7+ foreshocks and aftershocks, while no events of that size were recorded for the 1952 sequence.
Data source: USGS Earthquake Catalog
Methodology: Minimum magnitude: M5.5 (matching 1952 detection threshold) and M7
Region: Kamchatka subduction zone
OC: Charts created in Python
by Everyday-Wonder24