
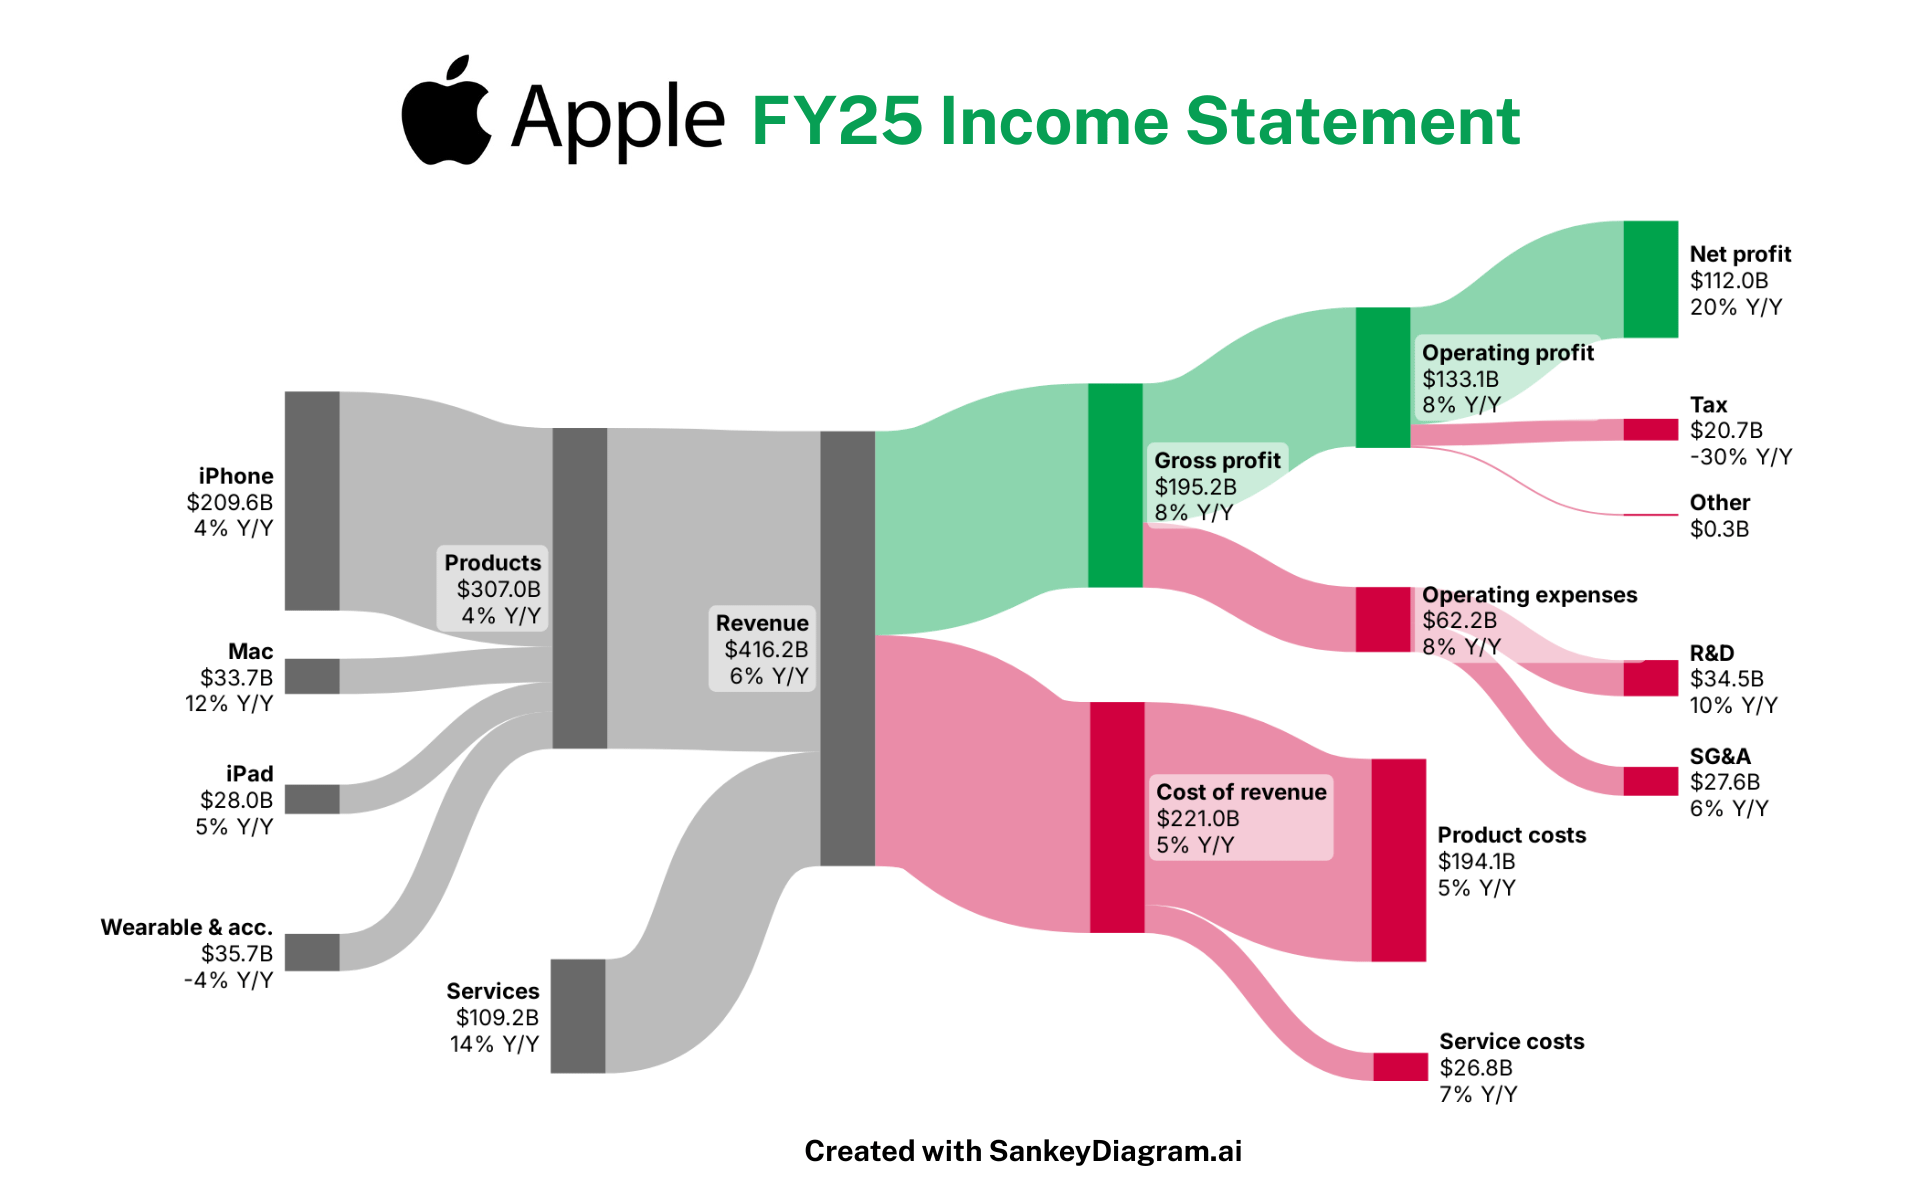
This Sankey diagram visualizes Apple’s FY25 income statement, showing how the company generated $416.2B in total revenue and ultimately produced $112.0B in net profit.
Key highlights from FY25:
- iPhone continues to dominate with $209.6B in revenue (+4% YoY)
- Mac saw strong growth at 12% YoY
- Wearables & Accessories declined 4% YoY
- Services grew to $109.2B, up 14% YoY
- Gross profit reached $195.2B (+8% YoY)
- Operating expenses climbed to $62.2B (+8% YoY), driven by R&D investments
- Net profit jumped 20% YoY, aided by a sharp tax reduction (–30% YoY)
Made with: Using SankeyDiagram + Canva
Source: Apple FY25 Annual Report (Investor Relations)
by FrostingTall9171
4 Comments
I don’t know anything about company profit, but that green part looks very thick.
133,1 out of 416,2 = 31,97% net profit before taxes
20,7 in taxes off of 133,1 = 15,55% taxes
Numbers in fucking billion USD of course. Is it just me or should they have to pay more taxes?
Made 8% more gross profit, paid 30% less taxes than year prior. How’s that make sense
So many business Sankeys … sooooooo many.