
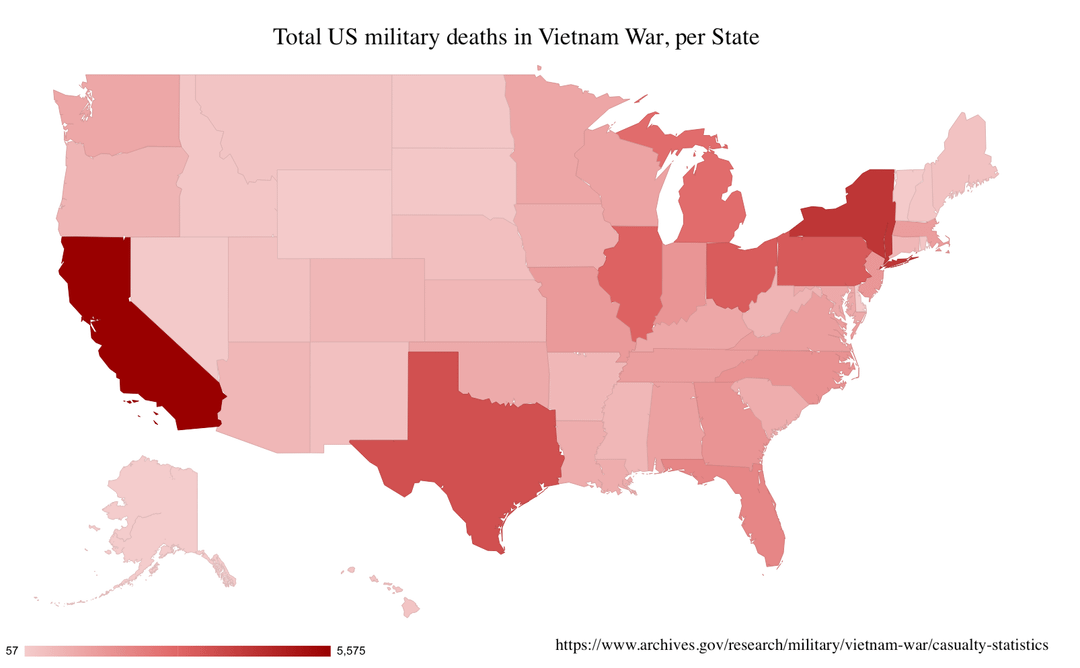
Sources: https://www.archives.gov/research/military/vietnam-war/casualty-statistics
https://pmc.ncbi.nlm.nih.gov/articles/PMC2621124/
Tools: Google Sheets (geo charts), Mac image preview app.
Note: I posted the second map on its own a few days ago. Hopefully that's ok with the mods.
by previousinnovation
8 Comments
Note that many US nationals from US territories died in Vietnam. Unfortunately Google Sheets doesn’t have a geo chart that includes US territories. Here are those numbers:
Puerto Rico: 345
Guam: 70
US Virgin Islands: 15
American Samoa: 4
Foreign: 4 (not sure who qualified for this category. It clearly doesn’t include the 134 Canadian nationals who died in Vietnam as members of the US military)
Canal zone: 4
Pretty clear which states produced the officers…
The median age of the people who died in this post is 21…
Holy fuck, how lucky am I to not be born on that era
Hey you fixed it. Good job
Super dumb war. Surpassed only by Iraq in the shear stupidity of the premise.
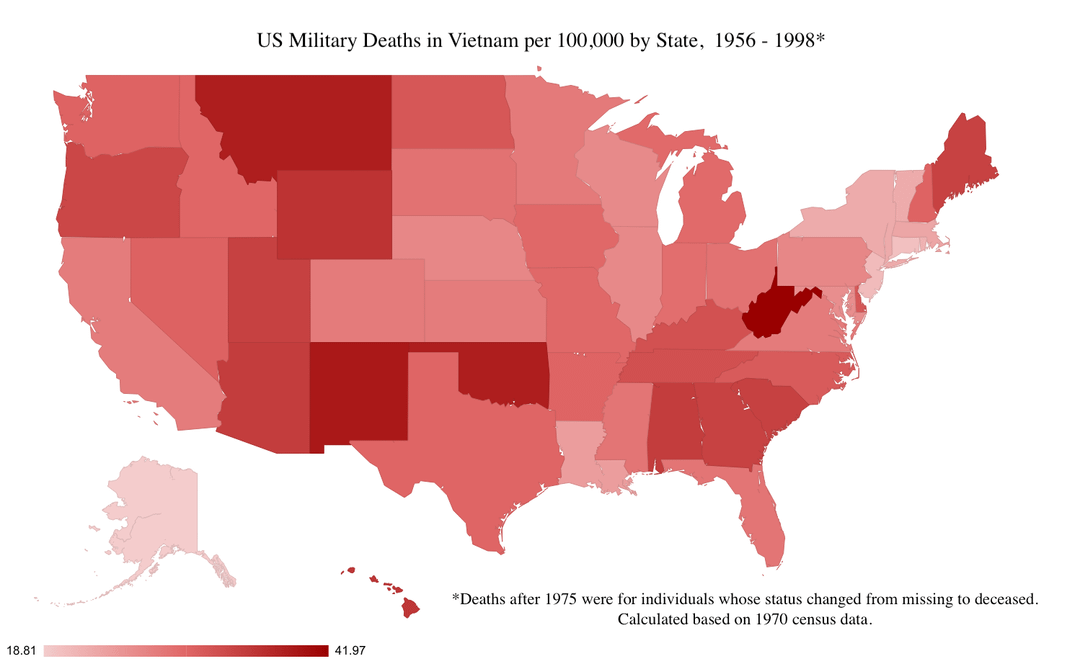
I’m wondering what it is about the pocket of NE states+NY+NJ that might have resulted in relatively fewer deaths per capita.
Is it a rural v. urban thing, where rural kids/families were more likely to enlist?
Thanks for posting both the raw totals and the per capita.
If I had to take a guess, it would be the per capita map would largely be the inverse of a per capita of college students and graduates for those states.
I’ve talked to a few people about the time and generally speaking getting a waiver was fairly easy if you could be considered a professional in any capacity, or on the path to being one (hence in college).
Sent halfway around the world to kill a bunch of civilians and burn down their villages.