
We examined the S&P 500 Shiller P/E ratio using data from Multpl.com and visualized the trend in R using ggplot2 to compare today’s valuations with past extremes.
Key takeaways:
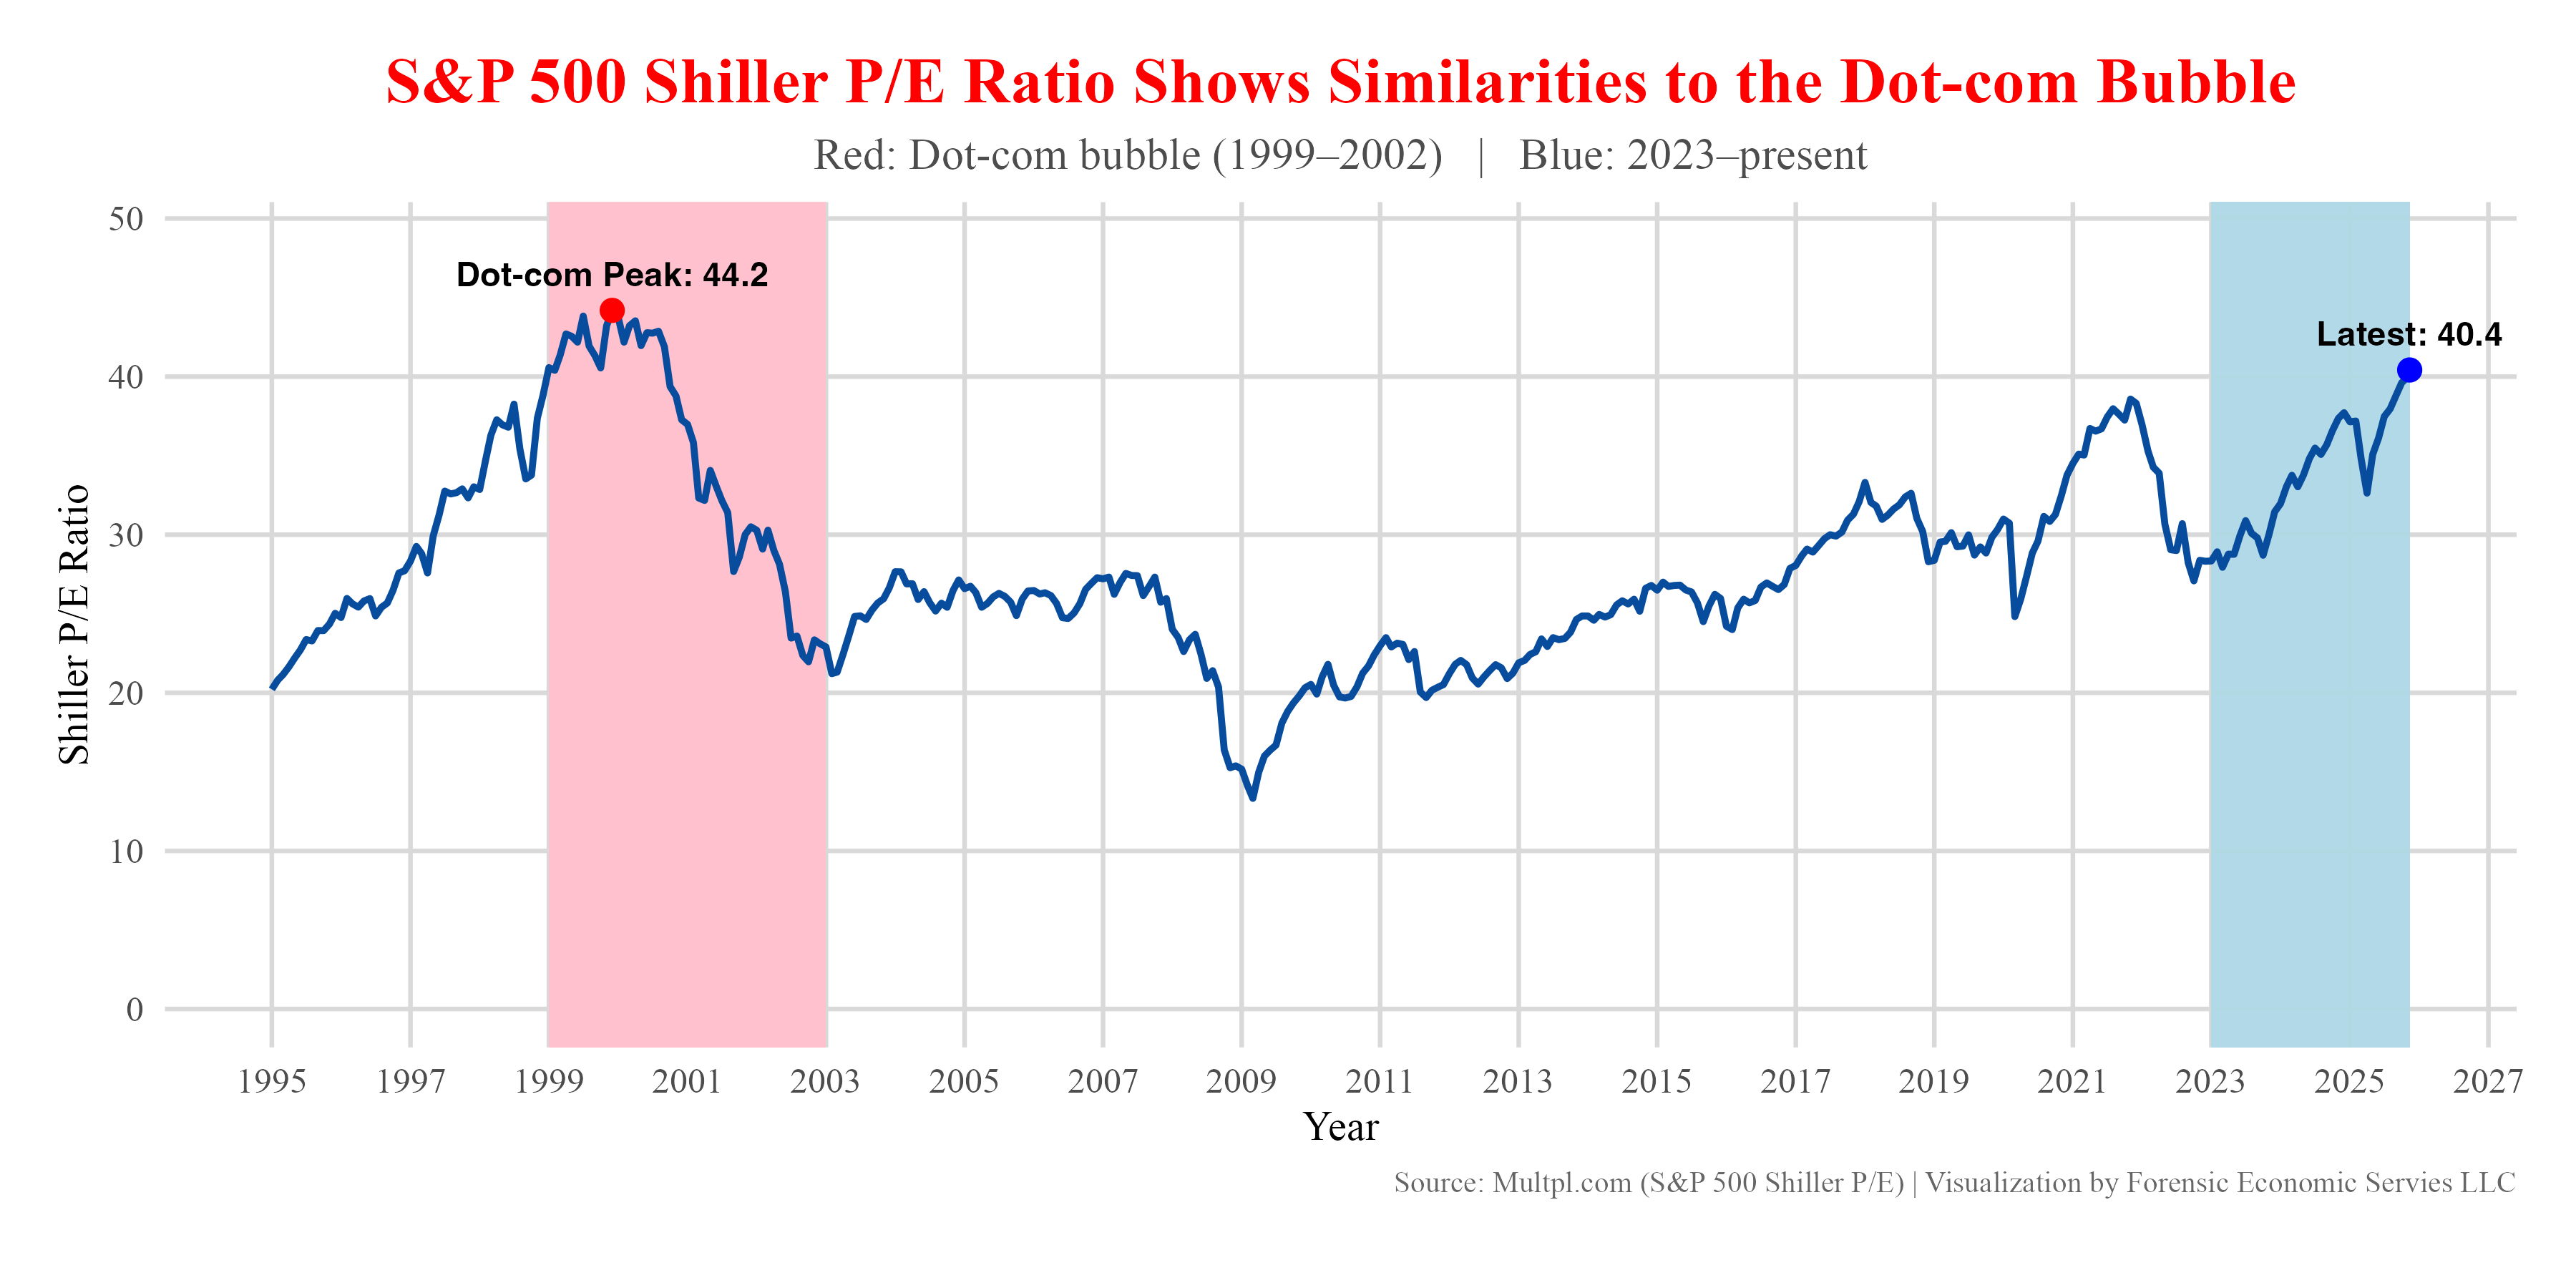
- Dot-com bubble (1999–2002): Peak Shiller P/E of 44.2
- 2023–2025: Recent reading near 40.4, placing today’s valuation in historically elevated territory
- While today’s economic structure differs from the 1990s, the long-run context shows how rare it is for valuations to reach this zone
Data Source:
- Shiller P/E historical data from Multpl.com
- Visualization built in R (ggplot2)
- By Forensic Economic Services LLC (Rule703.com)
by forensiceconomics
1 Comment
Where are you getting 40.4? The link says it’s 38, and the S&P500 one is even lower. Seems like a pretty big discrepancy.