
Hello! 👋
Even though World Cities Day (31 October 2025) has passed, we wanted to share some timely insights here. All our data is personalised, based on individual exposure and high-resolution modelling. For this post, we've aggregated it to city level so it's easier to spot trends and see what's happening globally. Check out our methodology below.
Summary: What our data shows
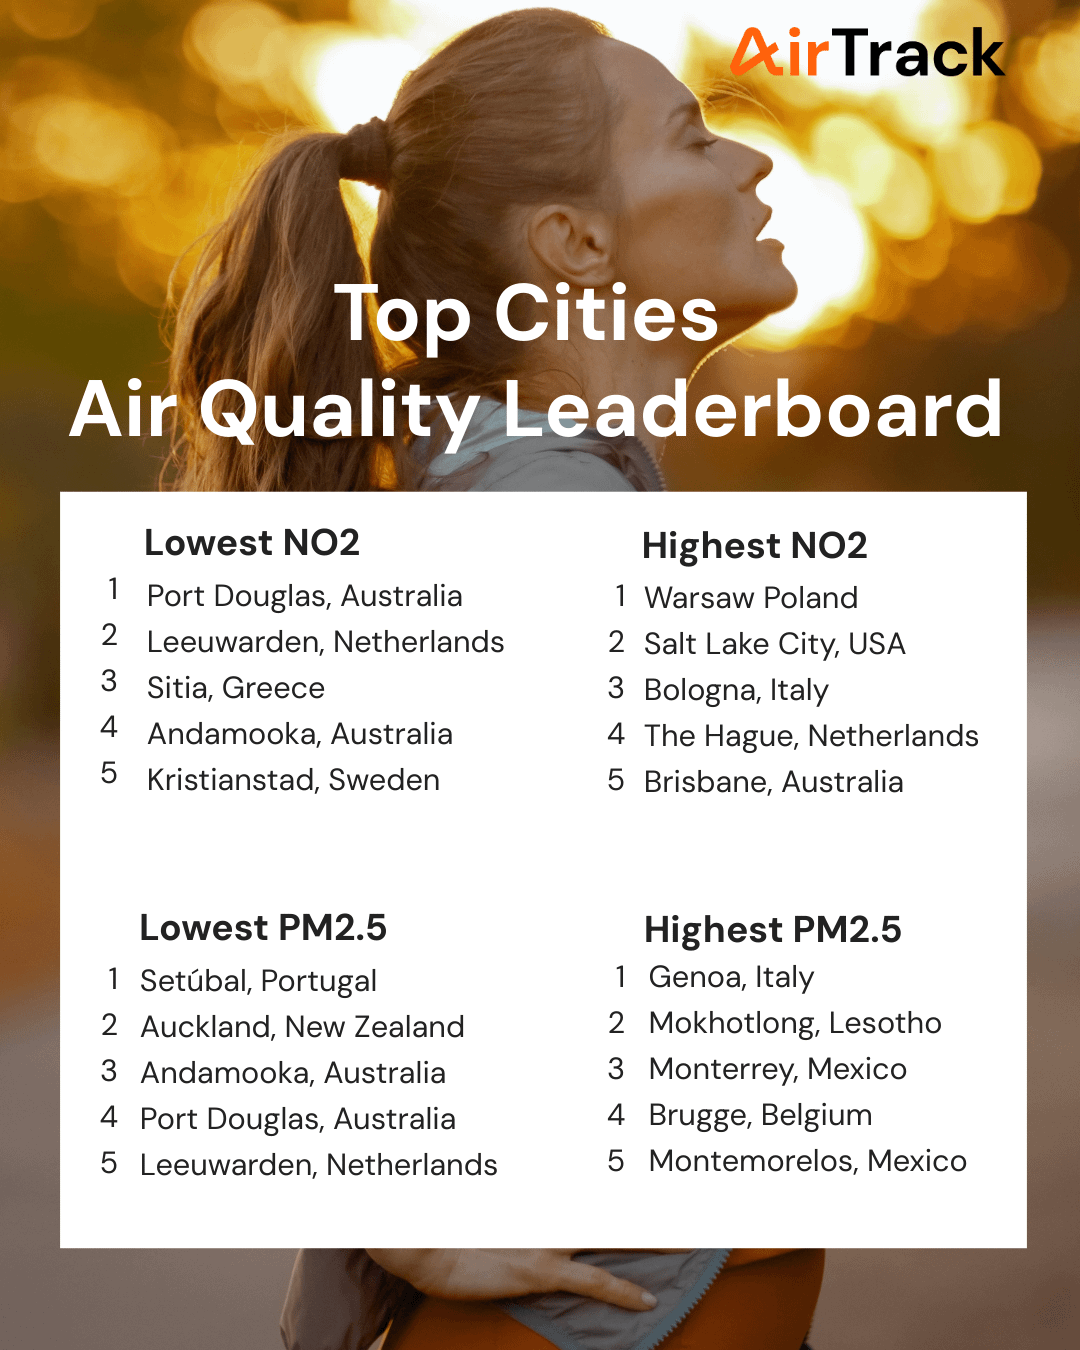
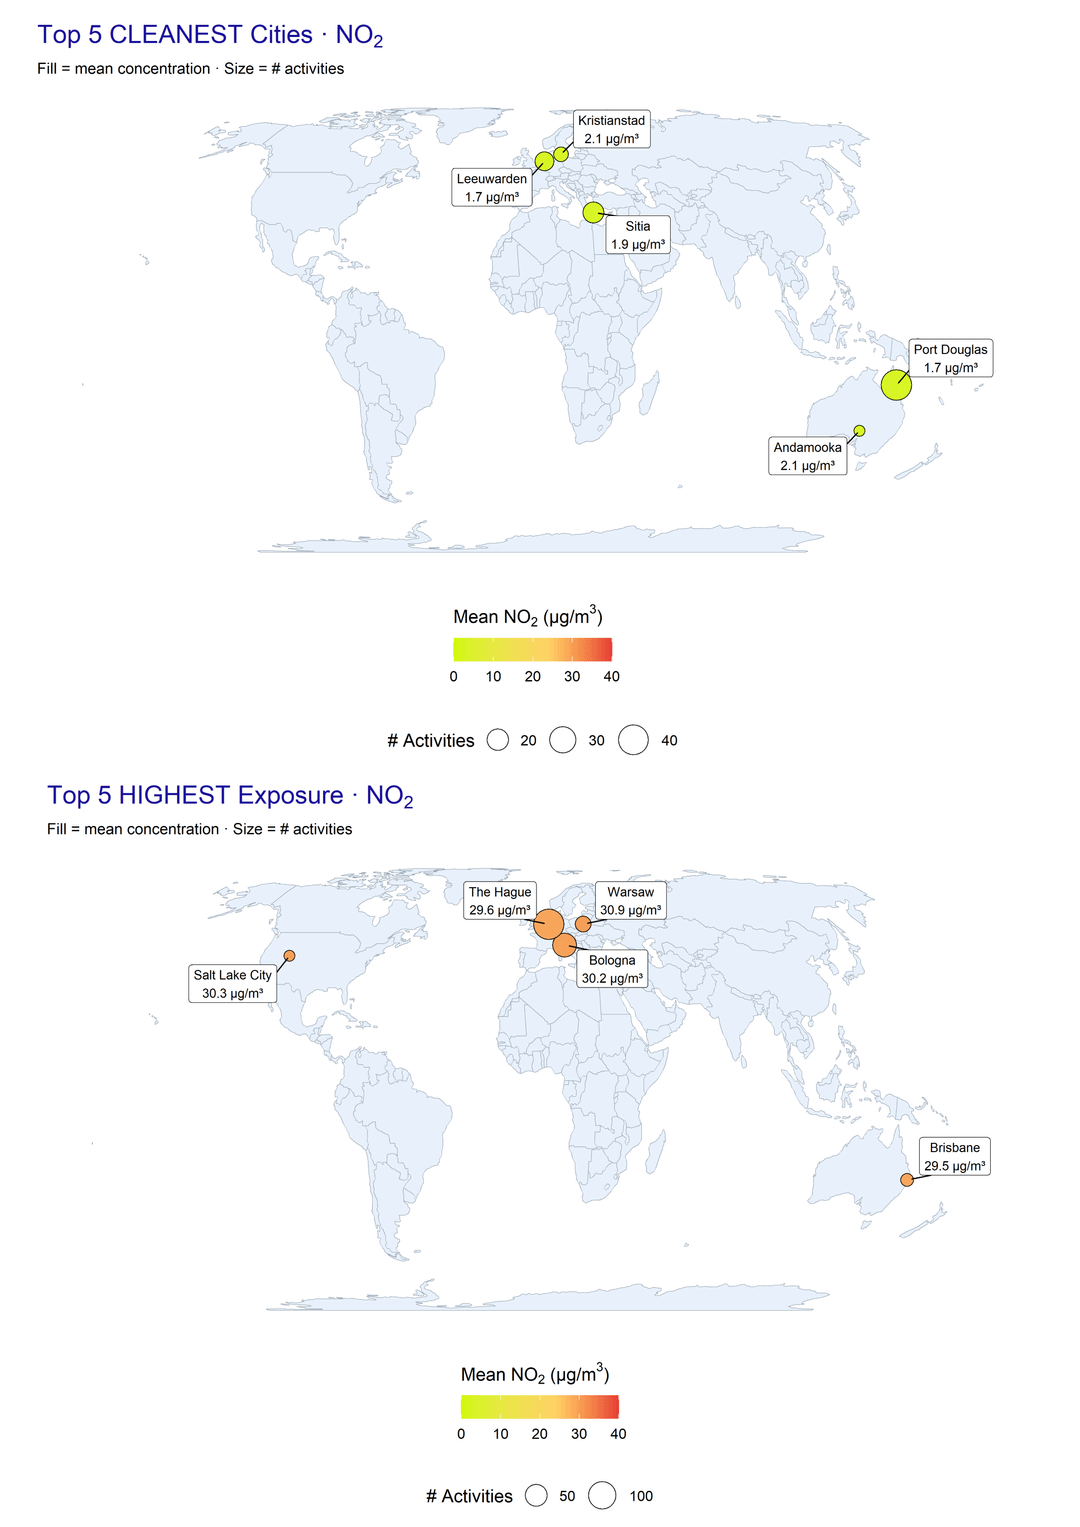
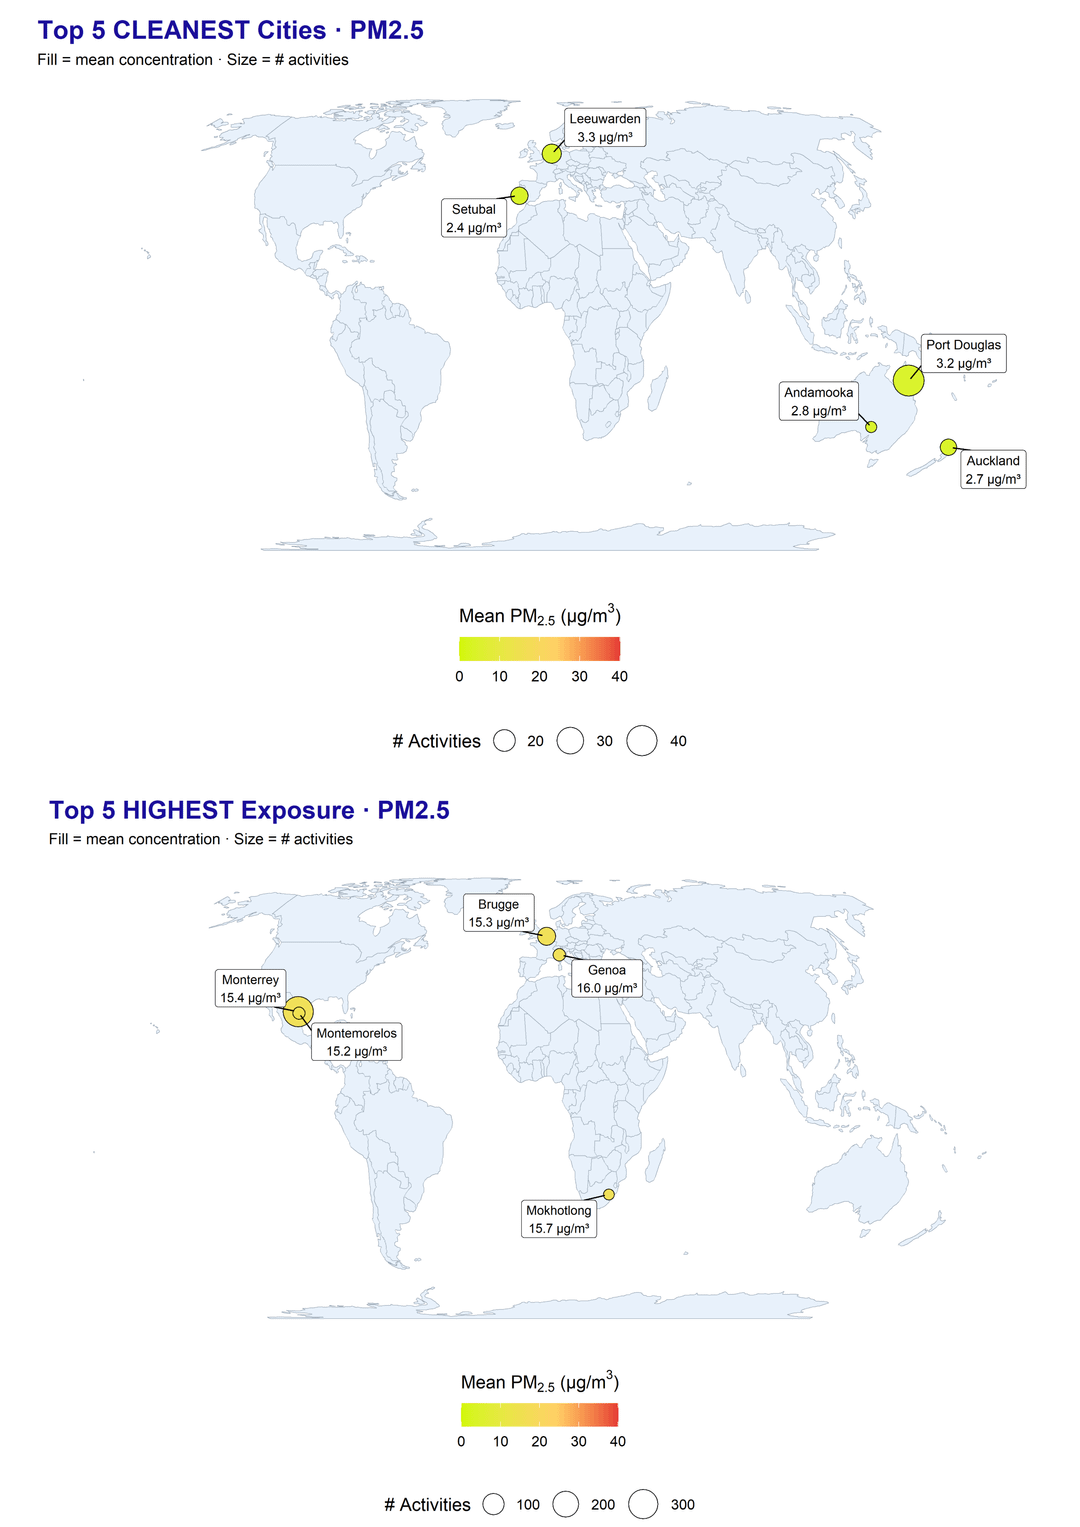
Looking at our latest city-level results:
- Some cities in Australia and the Netherlands rank among the cleanest overall, but even they can experience short-term spikes in nitrogen dioxide (NO2).
- Air quality shifts throughout the day and week, influenced by traffic patterns, weather, and local human activity.
- This means that even cities with generally clean air can have moments where exposure is higher than usual, and urban areas with moderate pollution may have brief windows of better air.
Our methodology
This data comes from 2,600+ AirTrack mobile app users worldwide who contribute anonymised exposure data through the app. We aggregate their personal exposure (based on high-resolution modelling, exposure algorithms + GPS) to the city level so it's easier to see global trends. It’s not a ranking of city pollution levels, but a reflection of how real people actually experience air pollution day-to-day. See how you compare by downloading AirTrack for free, today.
You can read the full blog in the AirTrack comunity: https://www.reddit.com/r/AirTrack/comments/1p2axlo/world_cities_day_reminds_us_better_data_means/
by Flaky_Restaurant5875
8 Comments
Or come there’s mostly western countries here?
Why would you take the data from 2600 mobile app users when you can look at data from giant companies that show accurate worldwide data?
This methodology seems questionable with a heavy user bias (looks like for western countries).
Almost all air quality studies would suggest PM2.5 (and I assume NO2) concentrations are way way worse in India and China.
Hideous data. Is this a thinly veiled ad? Your only contribution to Reddit is posting this to about 12 subs, half of which have removed it
So air quality in The Netherlands (a ridiculously small country) fluctuates so much that it has both the highest concentration of NO2 in the world and the lowest NO2? I call bullshit
“band doing a ‘world tour’ map” lmfao
You intentionally posted a list to r/dataisbeautiful?!?!?
This is just an advertisement for your product and you didn’t even take the time to format the data in a beautiful way?
It’s a fucking ad. Piss off with this.