
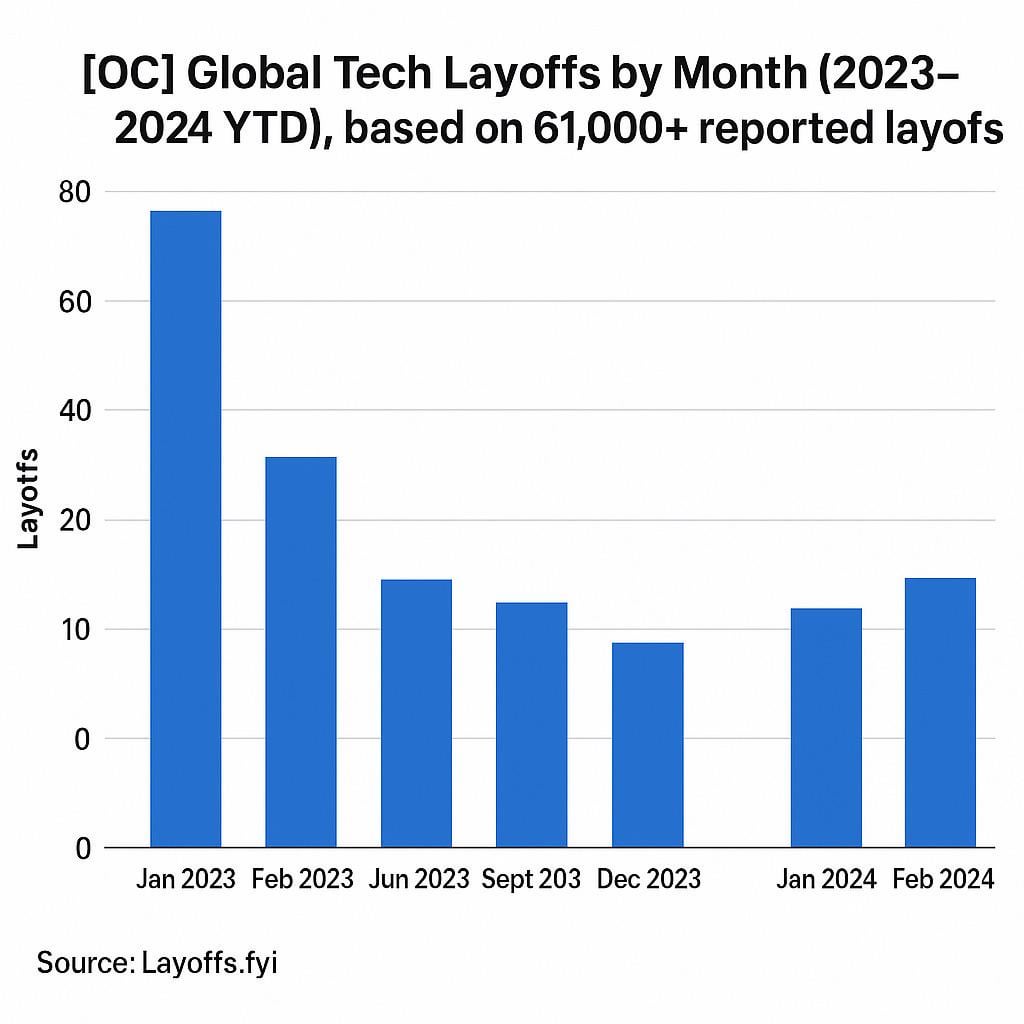
Here’s a visualization I made showing global tech layoffs by month from Jan 2023 to Feb 2024,
based on publicly reported numbers from Layoffs.fyi.
This chart highlights:
• A peak in January 2023 (~89k reported layoffs)
• A gradual decline through mid-2023
• A secondary uptick in late 2023
• Early 2024 showing moderate but persistent cuts
Despite the surge in AI investment, traditional software and consumer tech continue to shrink headcount.
Source: Layoffs.fyi
Visualization: Made by me (OC)
by Objective-Buy7528
4 Comments
Is there no data after Feb 2024? Is it on a 20-month delay? Or does the data just not exist after that?
Here’s what’s going on:
Layoffs.fyi doesn’t publish data on a fixed schedule, and the dataset isn’t always updated in real time.
Some months can have complete numbers within a few weeks, while other periods take longer because the site waits for publicly reported layoffs to accumulate.
So the gap after Feb 2024 isn’t a “20-month delay” — it just means that the dataset hasn’t been updated with enough verified entries for the more recent months yet. Once they publish new numbers, I’ll update the visualization as well.
Wild how the chart looks less like data visualization and more like a heartbeat monitor for the entire tech industry.
Two zeroes? Sept 203? Weird gap? Your caption says peak of 89k layoffs but i see 75kish? No scale, 10 what, 20 what? This doesnt mean anything as its not net, more people couldve been gired in that time? Did AI make this?