
Built in R using dplyr, ggplot2, ggfx, ragg, and gifski.
Data from NBA, compiled for ease of use by Dominic Samangy. Available at https://github.com/DomSamangy/NBA_Shots_04_25
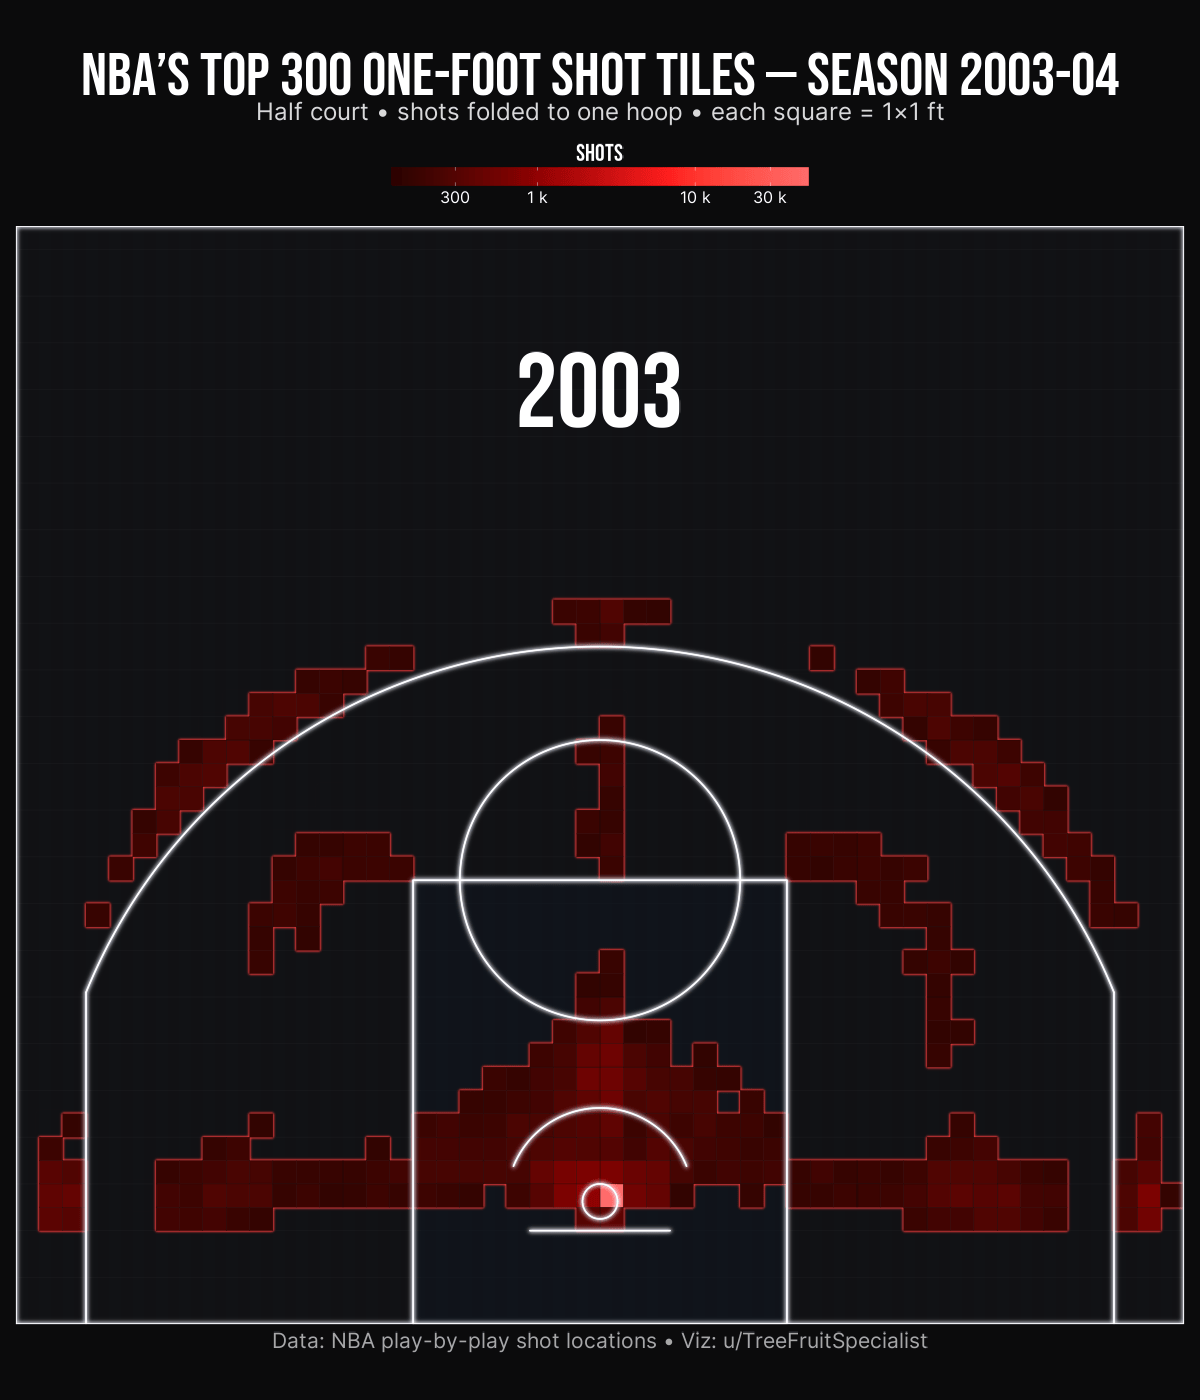
Based on 4,443,714 NBA play-by-play shot attempts, each frame shows one season folded onto a single half court and binned into 1×1-foot tiles. Color intensity represents the log-scaled number of shots from each spot.
Across two decades, the mid-range slowly evaporates, leaving only two islands of efficiency: the paint and the three-point line.
by TreeFruitSpecialist
1 Comment
I don’t know much about basketball, why is this?