
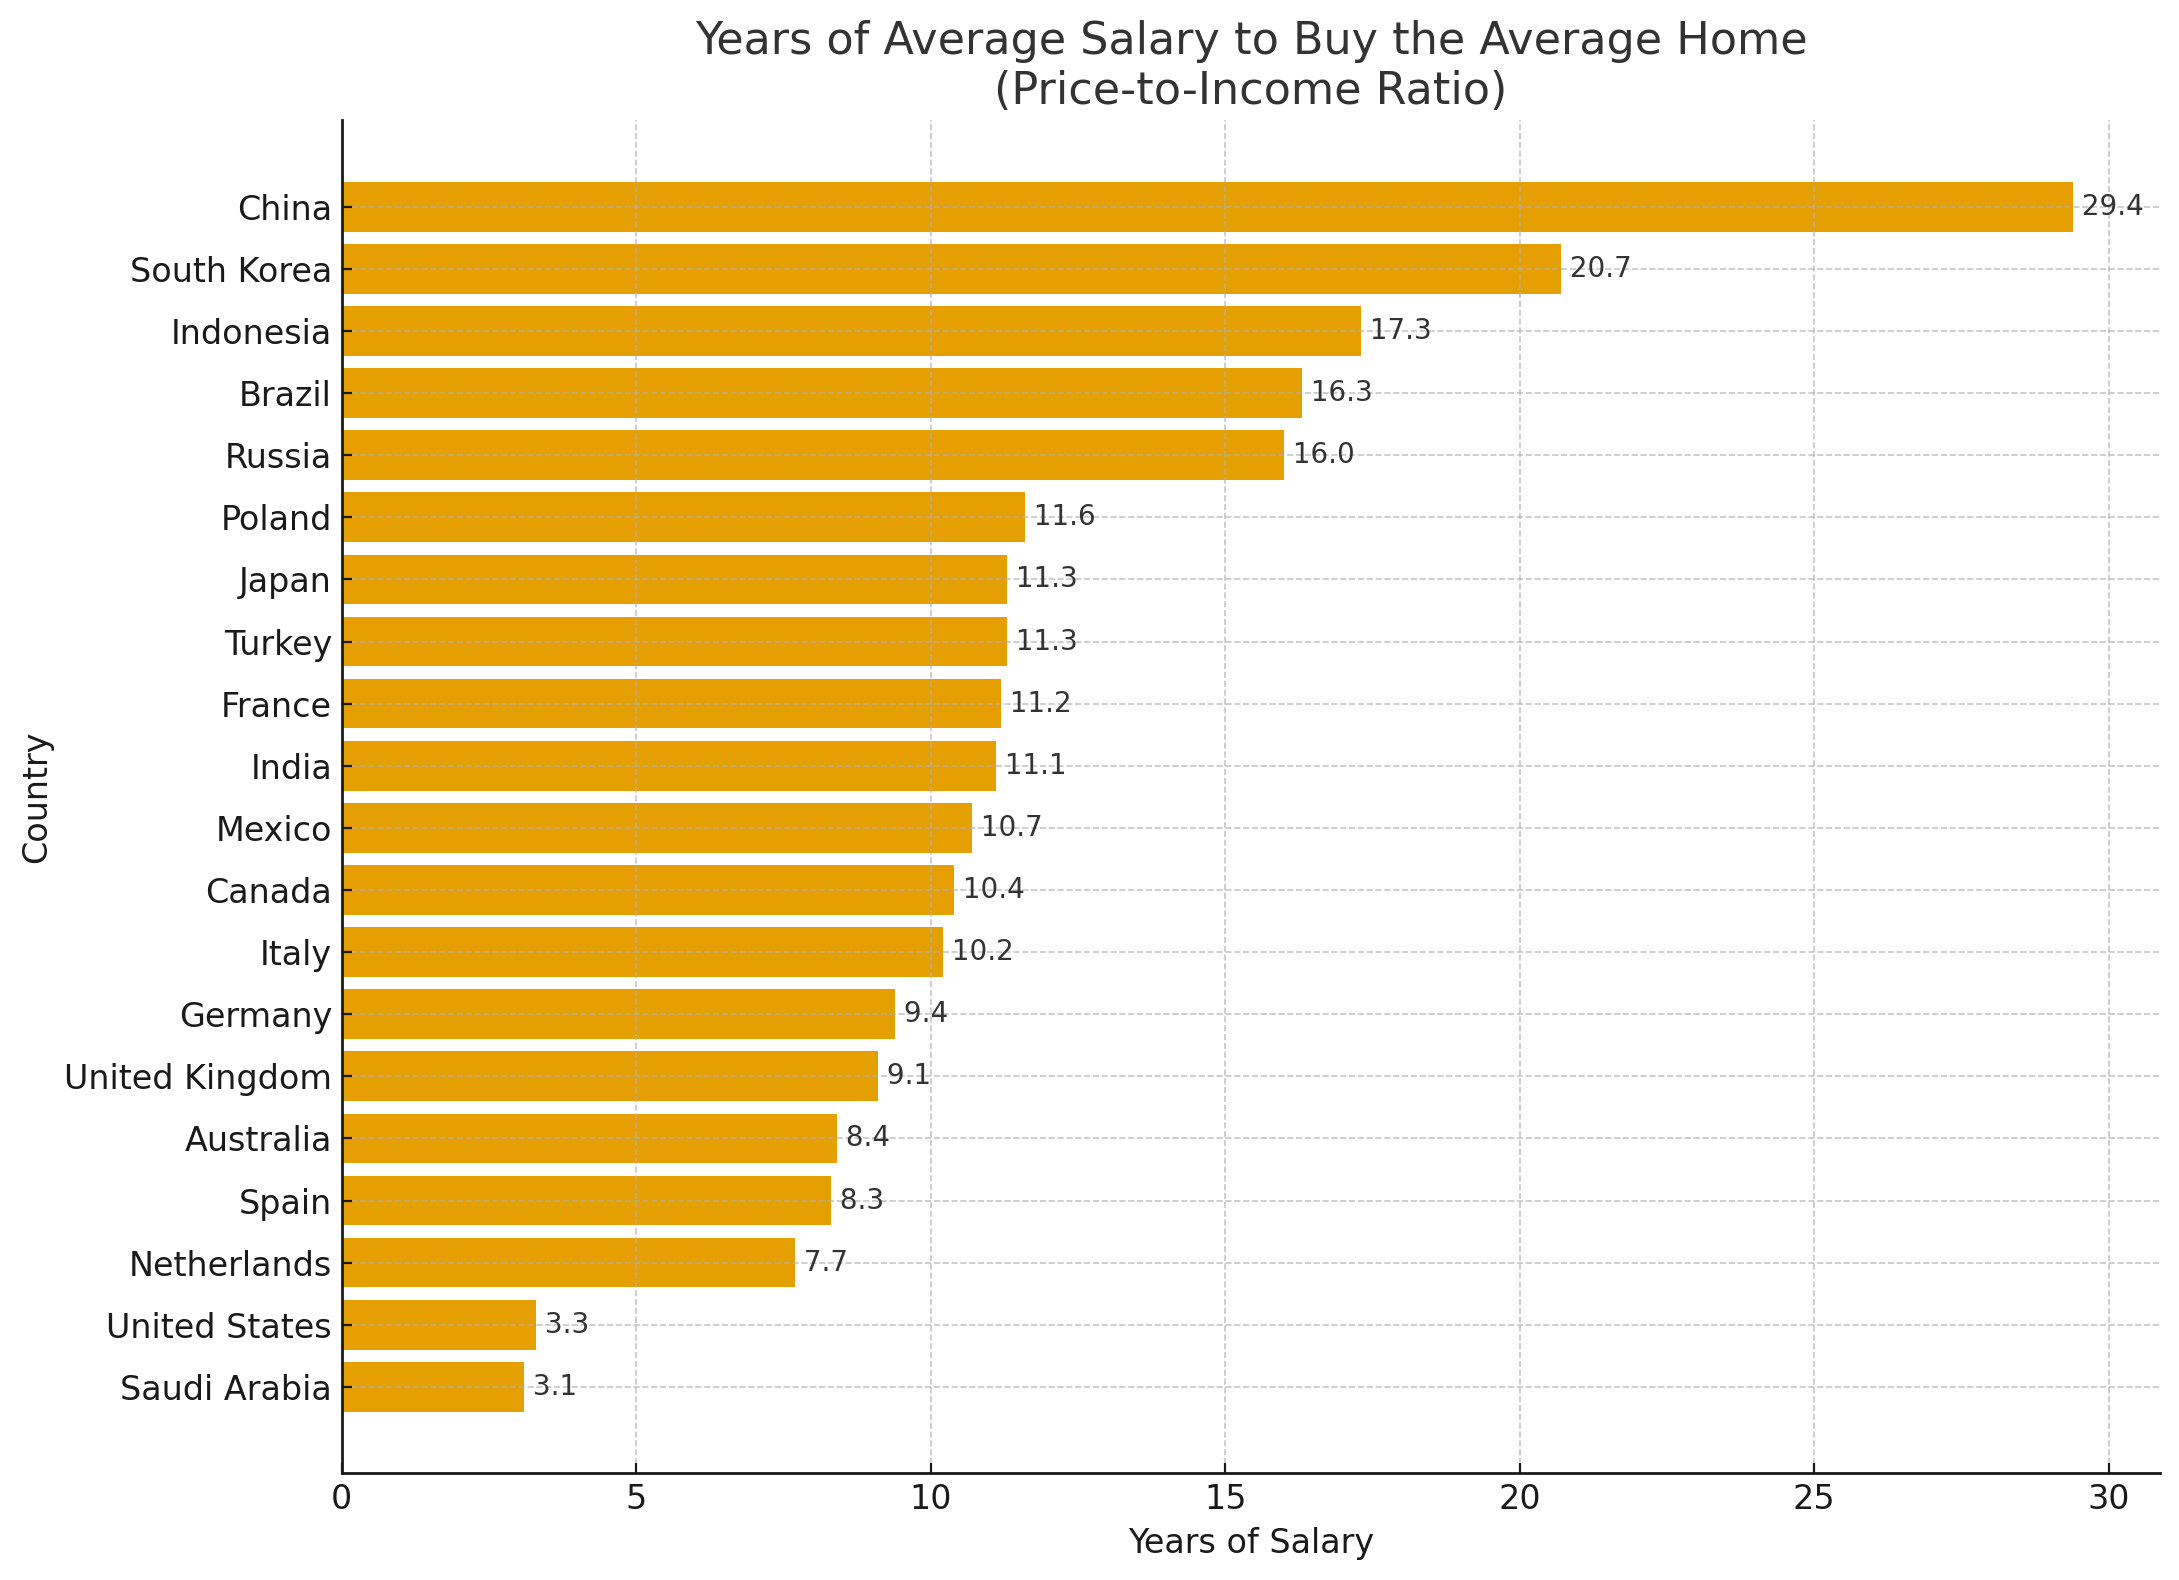
Here is a chart with data from https://worldpopulationreview.com/country-rankings/affordable-housing-by-country that shows the 20 biggest economies in the world ( from https://statisticstimes.com/economy/projected-world-gdp-ranking.php ) and see how many years of the average salary it takes to buy the average home.
By this metric the US has really really affordable housing compared to other countries.
by jrralls
33 Comments
Wow. This is surprising. Would not have guessed that the US was in this good of a position relative to other countries going off of Redditor’s opinions on current economic outlook for the average person…
Average salary isn’t a good metric for this
I’d love to see the same graph for the 20 largest economies in the UNIVERSE!
All this data becomes pretty meaningless when you use the average instead of the median.
The average household income in the US is over 44% higher than the median.
Ah so that is why the Chinese with money are driving up prices everywhere else investing vs investing domestically.
Also i hate the way this is sorted.
The housing situation in China is so disgustingly out of control. They’re throwing up these unaffordability numbers and yet the country is lousy with empty units.
Worst speculative housing bubble this world has ever seen. And everyone’s savings and retirements are tied up in it, so if housing prices drop, people lose their savings.
Not super intuitive results
I’m wondering about data quality in Indonesia. I’ve been there many times. Strikes me as odd from personal experience.
But american redditors have told us they’re the worst country in the world and everyone has it better than them.
There’s no way they were just being overly dramatic while being ignorant about the rest of the world, right?
Edit: seems like some americans didn’t appreciate being called out about their victimisation
Wait are you using GDP per capita as salary?
Coming from China it was a cultural shock when I saw the apartments of the same area cost roughly the same in the US as in China, by directly doing exchange rates.
Every country on this list has free universal healthcare except the U.S. and India.
This data is interesting, but not very useful without context. For example Germany has much better protections for renters that make renting a stable, secure long term option for most people. They also have much better social support systems, so accumulating wealth isn’t as critical as in the US where owning property is usually a big part of someone’s retirement savings.
You also have to consider that cost of *housing* is not the same thing as cost of *home ownership.* There are places (including parts of the US) where rent is relatively low but buying a home is incredibly expensive.
Sure I could buy a house in Kentucky on my New England wages but I don’t live there
Ahh yes, including the $30 million CEO salaries in your data set, well done
holy @#$%, really? how does anyone in china afford housing? are they all renting?
Anyone who’s actually been to any of these places knows this data is pretty meaningless. It’s a good reminder that averages and visuals can be misleading if you don’t look at the context behind it.
so the world population review data sources data collected by a site called [Numbeo](https://www.numbeo.com/property-investment/). From what I’m looking at, Numbeo is literally just crowd sourced data and anyone can submit data to it. I was literally able to submit a data point for Chicago’s 20 year interest rate that was accepted into the average (I do not live in Chicago lol). Seems to me like these data points are just complete nonsense
Do median. Average is bad data.
This is such a bad misrepresentation. Ask the average American if they think 3 and half years of their salary can buy a house
Median or average isn’t the real catch here.
Data source is from Numbeo. In other words, it’s **crowdsourced data from an English website**.
Perhaps a large chunk of China data points are from expats or well-educated locals in Shanghai or Hong Kong, same applies to any other non-English speaking developing countries.
The fact is that most suburb, rural, and Tier-3 or below city housing in China are dirt cheap, and those are where the majority of people live.
This data for the US does not seem right. As far as I can tell the average home price in the US is around $500,000 and the average income is maybe $80,000, although it’s not clear if what’s plotted here is household, family or individual income.
Maybe it’s somewhere I can’t find it but there didn’t seem to be any further data on the source linked.
Mean for anything involving salaries = useless trash garbage
Median: might be interesting. It would make it somewhere between 1.5-2x higher than this bar for the US
A quick google search tells me the average salary in the US is around $60-70k with the average home being $400k-500k (median vs mean). That’s like 5-8 years, not 3. I did some digging, and the website you linked is using Numbeo as their source, which apparently has reliability problems. They’re doing some [weird math](https://www.reddit.com/r/dataisbeautiful/comments/118xr9l/comment/j9jyoxc/) to come up with this number.
Like others said, medians draw a more accurate picture than averages in this context. This is a fairly basic concept when studying data of large populations across multiple demographics.
Case in point, average income is about 40k a year higher than median income in the US. This is why your conclusion about the US housing market affordability is wrong. The US is still better than many countries, unsurprisingly, but housing affordability is in fact falling off a cliff contrary to your conclusion.
what is average home?
It varies from city to city, and I don’t think it makes sense to just average the prices of all villages and cities.
And what percentage of annual income goes to housing? If GDP per capita is low for a country then it cant be more than 20%(80% goes to rent,food,bills and other things) and make it double worse.
Yet 90% of chinese own their homes and 65% of Americans…..
Also what world are most people buying a house at 3 years salary
If I was able to put 3.3 years of my wage, which is basically the American “average,” I would be moving into a crackhouse in my area. This feels discordant.
Complete bullshit. China’s home ownership rate is 96% and in the U.S. it is only 65.7%.
Is this “average salary” net or gross?
Rule number one of Data.
Never believe a single graph. The devil is always in the pivot tables.
You created a metric that is purporting to show something useful (affordability of housing), but it is not accounting for a huge variable: wealth disparity.
by using average salary instead of median, you are over accounting for the top 1% of salaries which are likely several hundred times the median in some countries, and the top 0.1% which is likely several hundred times the median, so these numbers have very little do with showing ‘affordability’ for people that ‘affordability’ is actually a concern for.
This plus your commentary at the end makes this whole post feel icky with anti-chinese/pro-US propaganda, even if unintentional
Clarifying questions:
1) Does this represent the cost of the house outright or the down payment required for the mortgage to be accepted? In some circumstances in the US, 20% is not required. VA (0% down) and FHA (3.5% down) together make up close to 25% of mortgages; they each have a limit to the cost of the house you’re allowed to buy.
2) Most US bureaus work calculations with medians. I found a 2025 article, though, that stated the average was $63,795 (median was $59,384).if we found up to $65,000 then 3.3x is $214,500. I tried to find a site that provided average home prices, not medians, but when I finally gave up and asked ChatGPT to find it for me, I was told that there’s no reliable source for averages (and that medians are used). Additionally, the raw data it could pull from to provide me with a unique estimate could only aggregate from RedFin or Zillow, which also use medians. So using averages was a bust.
The cheapest median home prices for 2025 can be found in West Virginia, approx. $240,000. While close, that is still not covered by 3.3years of salary.
3) Not clarifying so much as a piqued interest: I think it would be interesting to see how long it takes the average _(fill in nationality)__ making the average wage and saving the average amount to acquire a 20% down payment. (I’m off to poke around the Internet!)
This is the worst visualization I have ever seen on this sub. It is actively misleading. The poster clearly does not understand the difference between a median and an average, nor that average salary in most of the developed world is SIGNIFICANTLY higher than the average.