
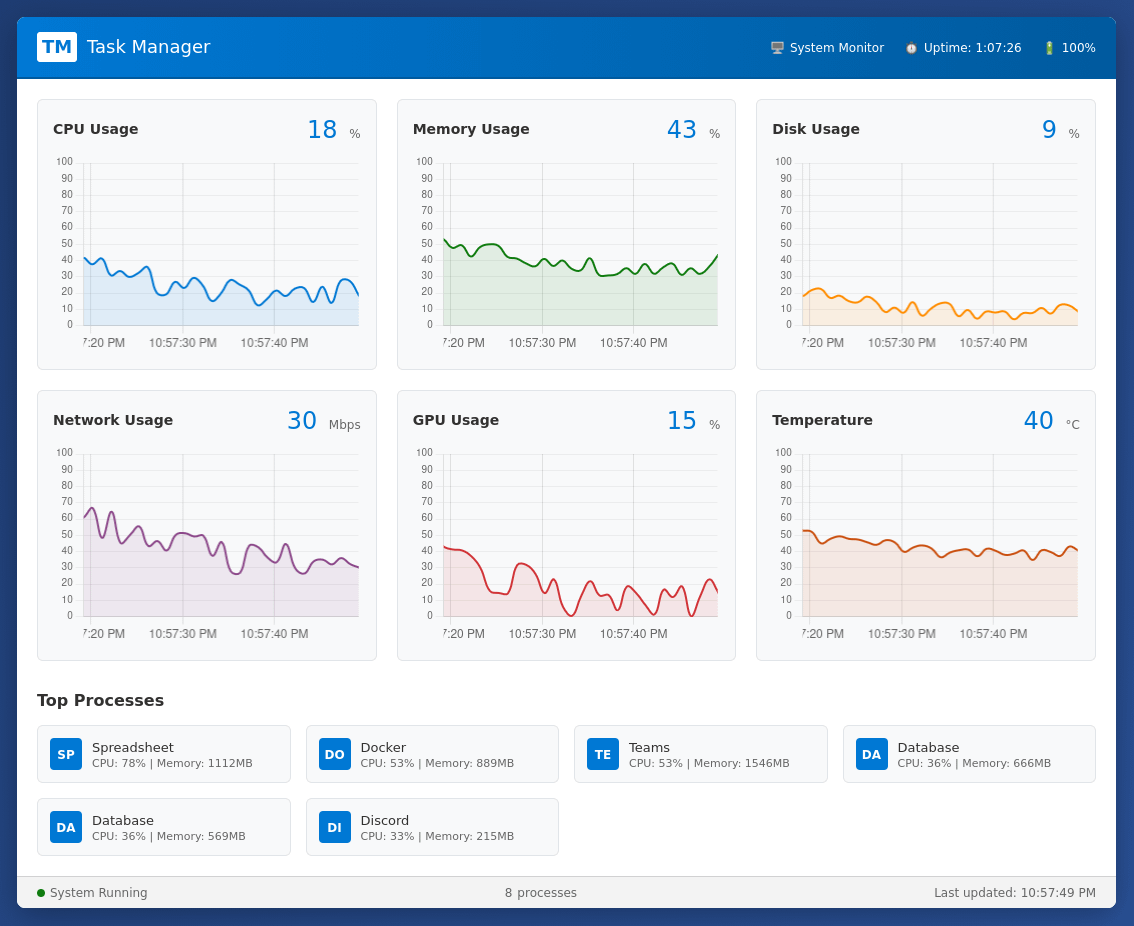
- Created a real-time dashboard showing 6 different system metrics streaming simultaneously. This uses a Chart.js streaming plugin that I forked and modernized to work with current Chart.js versions.
- The plugin handles automatic data cleanup and smooth scrolling animations. Each metric shows different patterns – from CPU spikes to network bursts – revealing how system components interact over time.
- My improvements include TypeScript support, 96% fewer dependencies, and Chart.js 4.x compatibility. The plugin prevents memory leaks by automatically removing old data points.
- GitHub: https://github.com/aziham/chartjs-plugin-streaming
⭐ If you find this useful for your projects, a star on the repository would help others discover it too!
What other real-time data would you like to see visualized this way?
by Velocity-Prime