
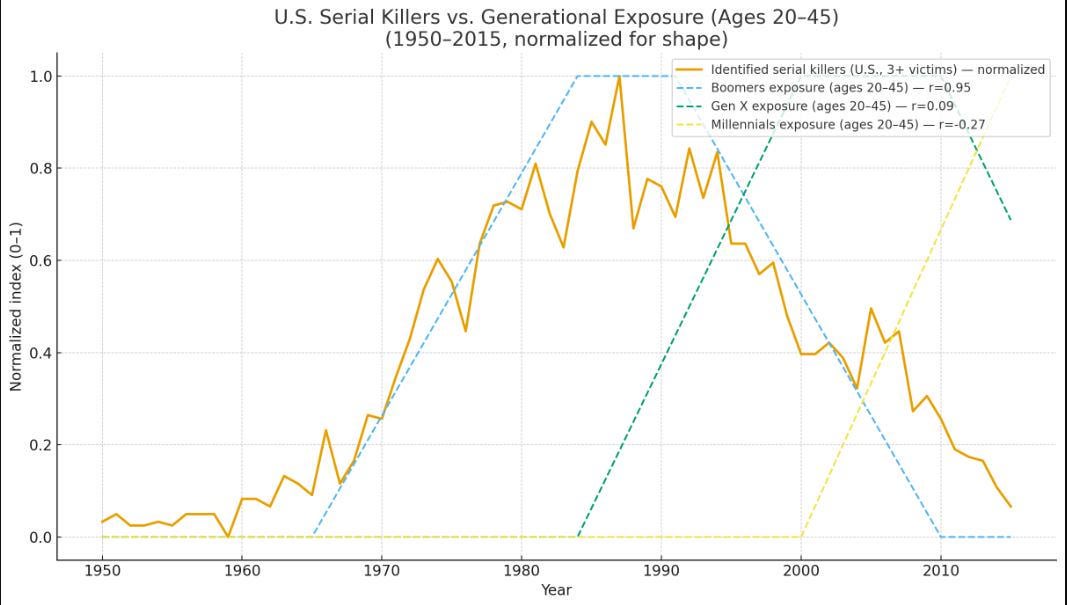
I overlaid the annual count of identified U.S. serial killers ( 3+ victims) with three demographic pass-through curves for the three major current US Generations (Baby Boomers, Gen X, and Millennials) each convolved with an active-age built from the Radford/FGCU serial-killer age stats.
- Active-age bell curve: 20 – 45 years of age . First, what % of SK's start between ages 20 and 45? Using Radford/FGCU’s age-at-series-start distribution by decades: 20s = 45.3%, 30s = 27.0%, 40s = 10.7%. To translate “40s” into 40–45, we need a within-decade split; the report only provides 40–49. Assuming a roughly even spread across the 40–49 bin, 6 of 10 years (ages 40–45) would account for about 0.60 × 10.7% ≈ 6.4%. BUT! If anything that underestimates things because the younger you are in your 40's the more likely you are to not have physical disabilities that could impair your serial killing abilities so I'm going to arbitrarily bump that up to 7.7% which gives us an estimated share of the 20–45 age bracket to be ≈80% of serial killers.
- Generations (birth years):
- Baby Boomers: 1946–1964 (U.S. Census convention)
- Gen X: 1965–1980 (Pew)
- Millennials: 1981–1996 (Pew)
What we see
- Boomers : r ≈ 0.95 vs. the measured series. The curve rises in the early 1970s, peaks mid/late-1980s, and declines through the 1990s, matching the classic U.S. serial-killer surge/ebb REDONKULOUSLY well.
- Gen X (green, dashed): r ≈ 0.25. The curve peaks late 1990s–2000s (doesn't match at all.)
- Millennials (yellow, dashed): r ≈ −0.23. Their pass-through ramps mostly after ~2005 (doesn't match at all. )
Graph made in Chatgpt.
(sources)
- Radford/FGCU Serial Killer Information Center (annual counts, age tables): http://maamodt.asp.radford.edu/Serial%20Killer%20Information%20Center/Serial%20Killer%20Statistics.pdf
- Baby Boomer cohort definition (U.S. Census, 1946–1964): [https://www.census.gov/library/stories/2019/12/by-the-numbers-baby-boomers.html]()
- Gen X and Millennial definitions (Pew Research Center): [https://www.pewresearch.org/short-reads/2018/03/01/defining-generations-where-millennials-end-and-generation-z-begins/]()
by jrralls
5 Comments
The number of serial killers has dropped precipitously as law enforcement forensics have improved – as evidenced by the solid line in your graph. Of course the curve won’t match up well with Gen X and later.
Probably not much of a ‘causal’ variable, but I’d love to see this correlated against atmospheric lead levels.
looks like the real headline is “serial killers are boomers”
The obvious conclusion is that boomers are all serial killers, but I think this reflects copycat crime and the fads and trends of extreme misanthropes. Back in the ’70s, if you wanted to be the worst of the bad guys you’d take up serial killing. In the ’90s, all the cool psychopaths were doing workplace shootings. If you wanted to be a villain in the 2010’s, school shootings were where it was at.
How do I read this for understanding the dashed lines for each generation? So millenials is just going up?