
Source: https://data.un.org/Data.aspx?d=UNHCR&f=indID%3ARef
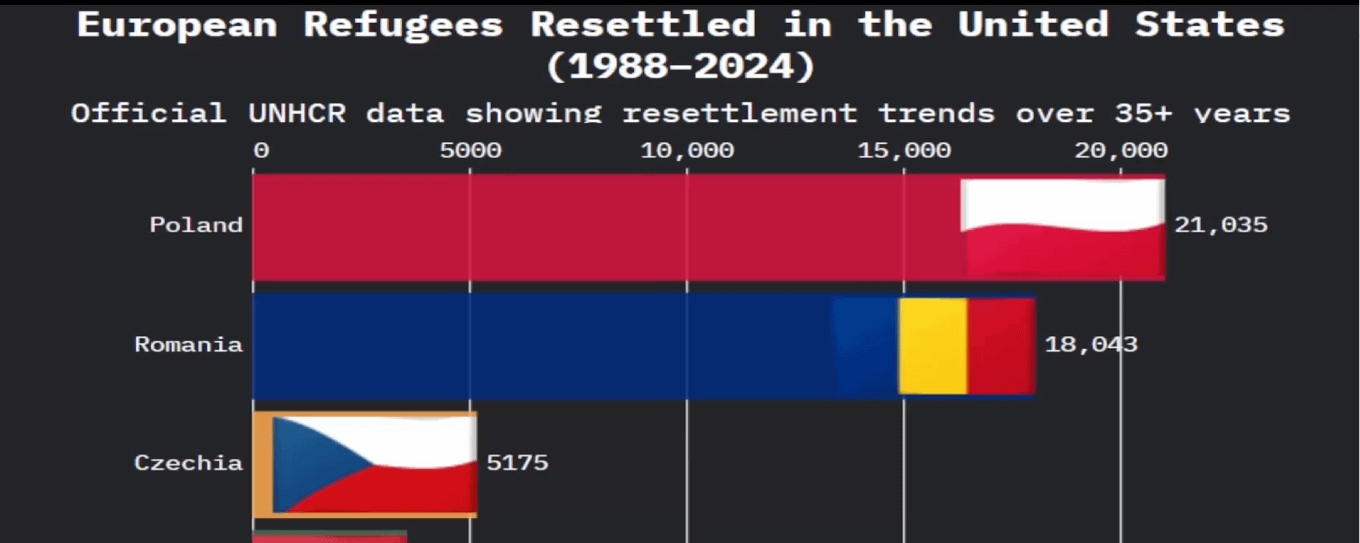
This snapshot shows refugee resettlement to the U.S. in 1988, using verified UNHCR data. Each bar represents the number of refugees resettled from that country in that single year.
This chart shows how Romania, Poland and Czechia led refugee resettlement to the U.S. in 1988. Patterns like this shift year by year depending on global conflict, migration policy, and U.S. foreign relations.
The full video reveals how countries like Albania, Belarus, and Ukraine also rise and fall across the timeline.
▶️ Full video here → https://www.youtube.com/watch?v=ziZKtOi8xlM
All data comes from the official UNHCR Resettlement Statistics at the United Nations portal.
Let me know what you think or how you'd improve the visual pacing or data clarity.
Data Source & Verification:
All figures come directly from the official UNHCR Resettlement dataset via the United Nations Data Portal:
🔗 https://data.un.org/Data.aspx?d=UNHCR&f=indID%3aType-Ref
The data and overlays are based on verified UN records and nothing is estimated or made up.
If you think something looks off, feel free to check the source yourself. I’m not debating numbers; they’re publicly available for anyone to confirm.
by Dismal-Remove4070
4 Comments
I do think something looks off, and its the flag images. Why are the lines wavy if the flags aren’t?
Just the first frame already makes it seem sus, with Czechia in 1988. Also, no USSR? No Yugoslavia? What is a refugee in this context? This data just is not plausible as presented and needs explicit asterisks at the very least.
Reagan Amnesty. All of Chicago got papers thanks to Martial Law.
When you look up “misleading” in an encyclopedia this post is what you find.