
Source: https://data.un.org/Data.aspx?d=UNHCR&f=indID%3AType-Ref
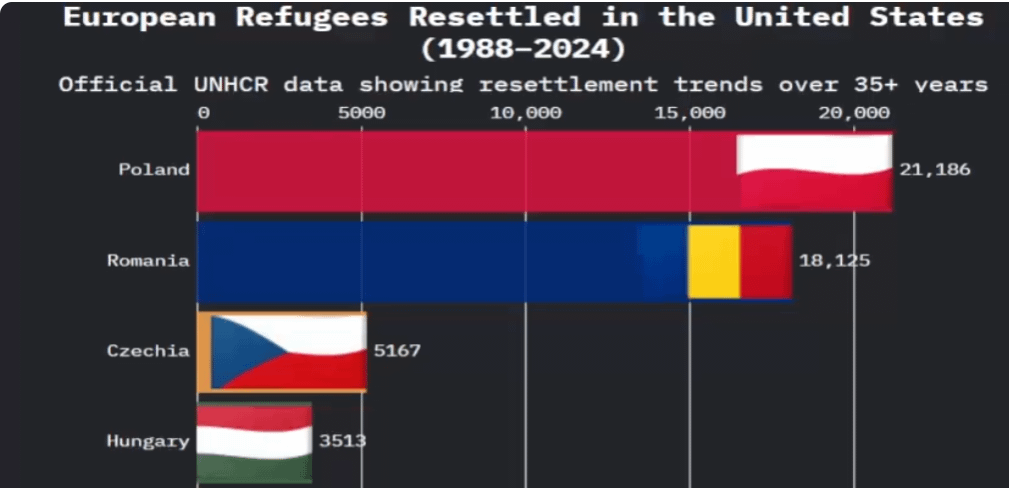
This snapshot shows refugee resettlement to the U.S. in 2001 only which is part of a full animation I made using official UNHCR data from 1988 to 2024.
This chart shows how Romania, Poland, Czechia, and Hungary led refugee resettlement to the U.S. in 2001. Patterns like this shift year by year depending on global conflict, migration policy, and U.S. foreign relations.
The full video reveals how countries like Albania, Belarus, and Ukraine also rise and fall across the timeline.
The full chart helps show how U.S. refugee policy and global events shaped who was able to resettle.
Full video here –> https://www.youtube.com/watch?v=ziZKtOi8xlM
Data Source & Verification:
All figures come directly from the official UNHCR Resettlement dataset via the United Nations Data Portal:
https://data.un.org/Data.aspx?d=UNHCR&f=indID%3AType-Ref
The data and overlays are based on verified UN records, nothing is estimated or made up.
If you think something looks off, feel free to check the source yourself. I’m not debating numbers; they’re publicly available for anyone to confirm.
There was a small render issue, so this one’s stuck at 480p, should have a higher-res version soon.
by Dismal-Remove4070