
blog post with code to create this using geopandas and matplotlib: https://aaronjbecker.com/posts/matplotlib-choropleth-mapping-smoking-rates/
2022 was the last year in which all states had sufficient data; conducting interviews by phone is getting harder, attitudes towards the CDC notwithstanding.
by aar0nbecker
21 Comments
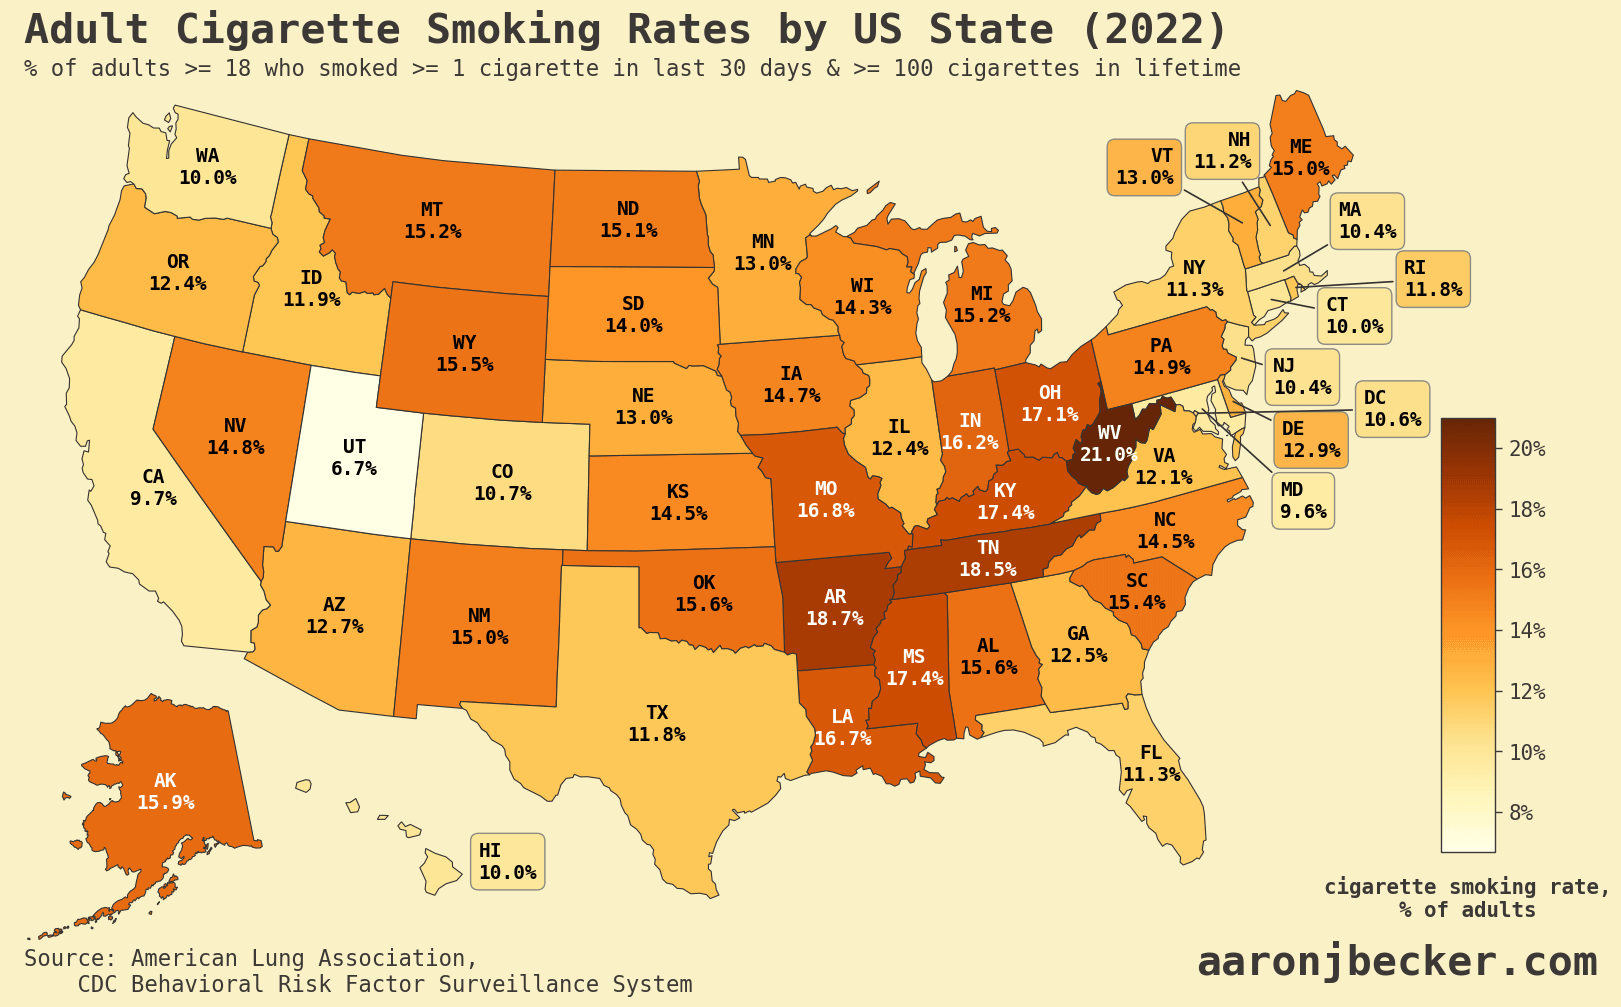
Data source: American Lung Association [https://www.lung.org/research/trends-in-lung-disease/tobacco-trends-brief/data-tables/ad-cig-smoking-state](https://www.lung.org/research/trends-in-lung-disease/tobacco-trends-brief/data-tables/ad-cig-smoking-state)
Tools: python, Jupyter, pandas, matplotlib, geopandas.
Full reproduction code: [https://aaronjbecker.com/posts/matplotlib-choropleth-mapping-smoking-rates/](https://aaronjbecker.com/posts/matplotlib-choropleth-mapping-smoking-rates/)
Inspired by my father-in-law, who quit last month after 60 years of smoking!
Any formatting advice is greatly appreciated– are the labels too busy? should I use discrete colors? is the color bar size/placement OK?
The numbers are faaar more similar then I assumed they’d be.
oof the smoker’s teeth colors
WV got that coalness as well.
No need to smoke cigs in UT when you can get all those carcinogens from the valley smog anyway.
Ahhh I remembered cigarettes exist again, now I have desire
Excellent pallete, great formating, and great presentation of data.
This is about a third of the rate 50 years ago.
People still smoke cigarettes!!??
Why does the scale start at 8% and stop at 20% when the actual data is between 6.7% (UT) and 21% (WV) ?
The more I see these state scale maps the more I see the future is in Utah
What’s happening in West Virginia?
California needs to get that number down further. It’s lovely not encountering any smokers here and it’s incredibly unpleasant every time I do.
Americans need to start bragging to Europeans about how little we smoke.
Mormons see a pack of cigs and be like 🙅♂️🙅♀️
Utah only because of the Mormon influence on the state.
How is anyone alive in West Virginia lol. Seriously, map after map…
Happy to be last in this metric.
Gotta be honest I expected Washington’s number to be higher than Texas. Lived in Seattle for seven years and it was like going back in time to the 90s where there were smokers everywhere. Just without the smoking sections in restaurants and bars.
And 90% of the time education is a factor as is political affiliation and firearm ownership. I’ll let you figure out how this might play out.
I would’ve thought Kentucky and Virginia were higher.