
[OC]
Sources:
- Office of Foreign Labor Certification (OFLC): H-1B Labor Condition Application (LCA) Data, FY 2025
- US Bureau of Labor Statistics (BLS): Occupational Employment and Wage Statistics, May 2024
Notes:
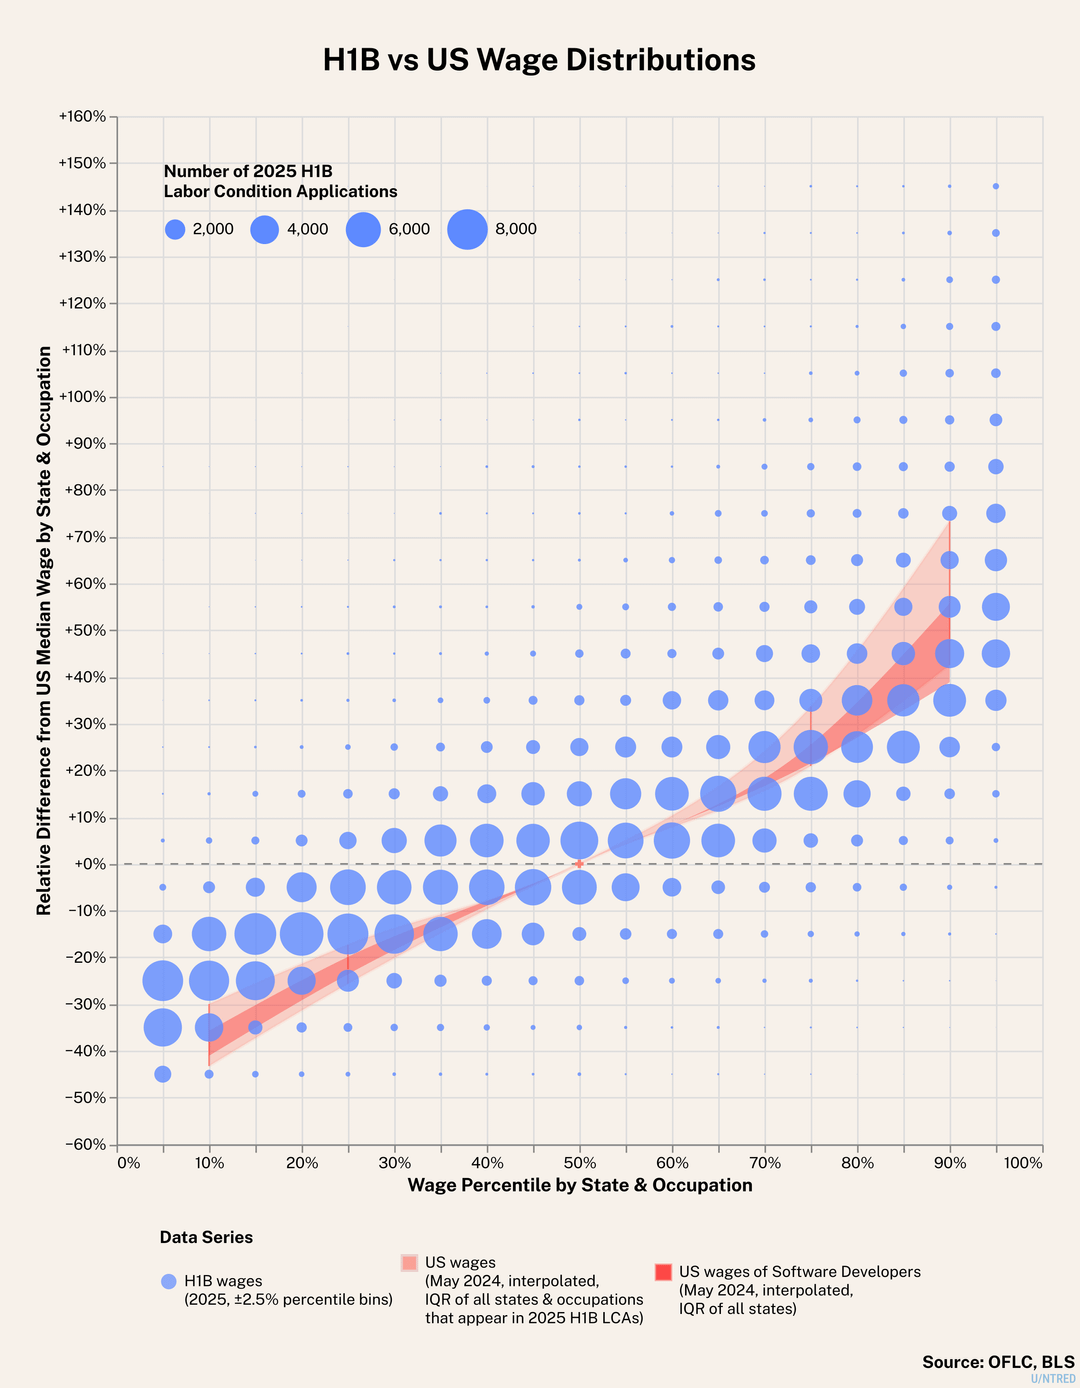
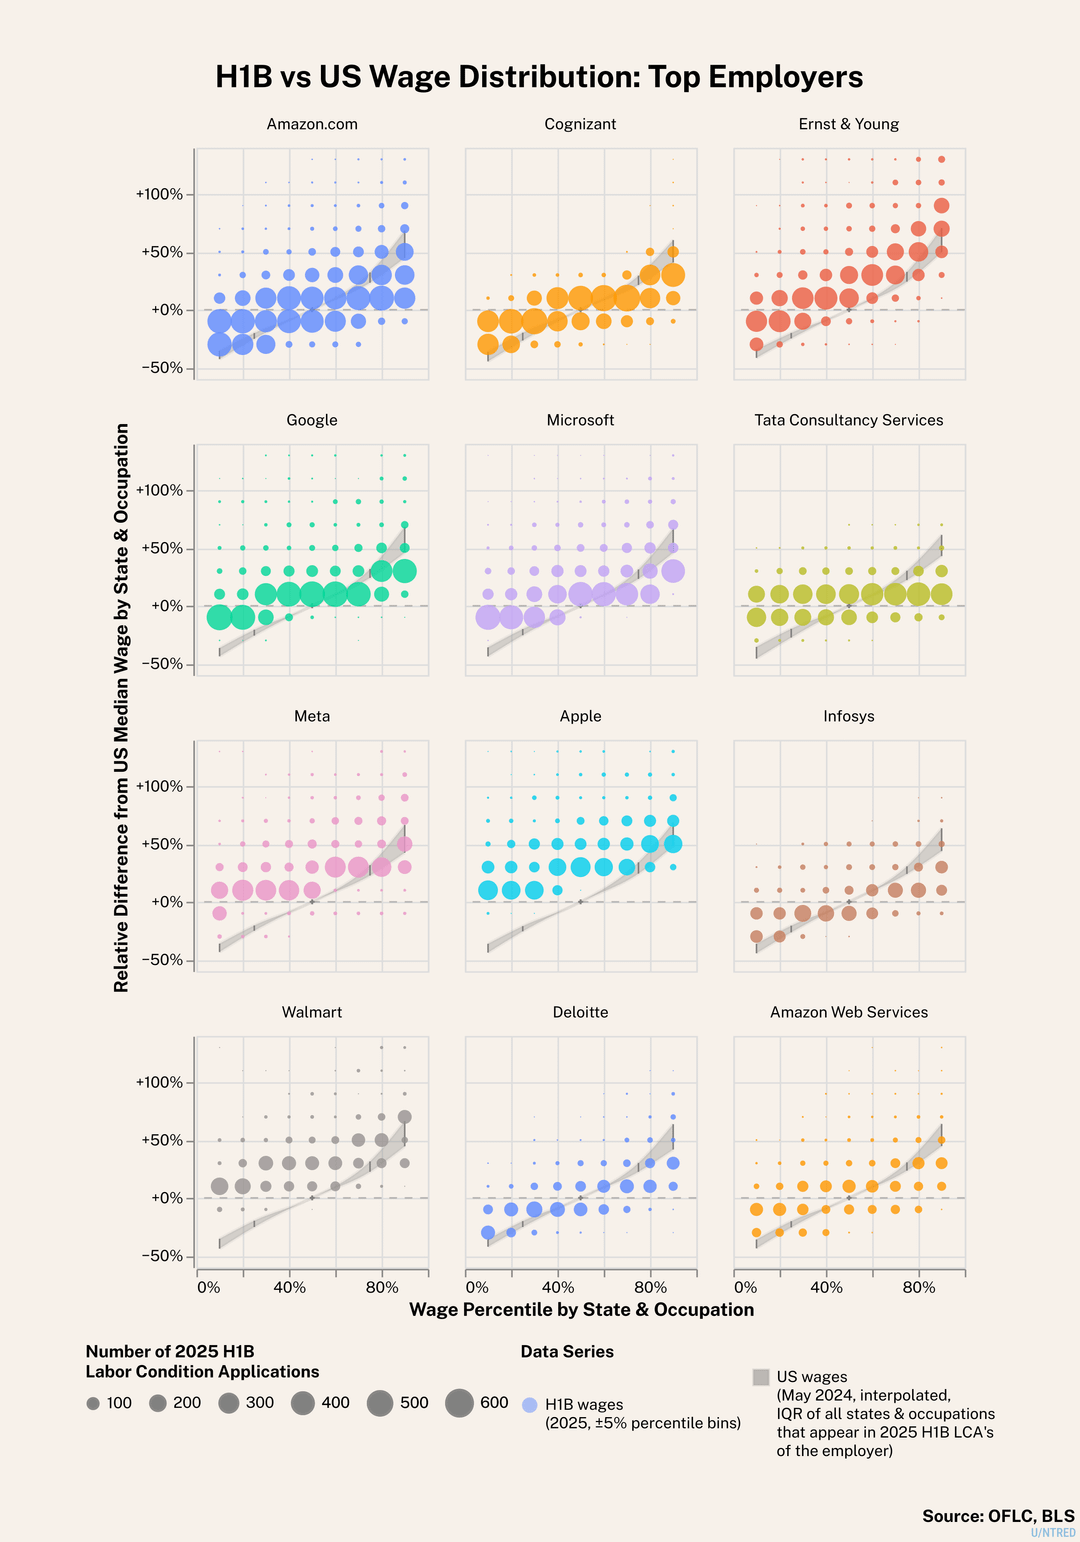
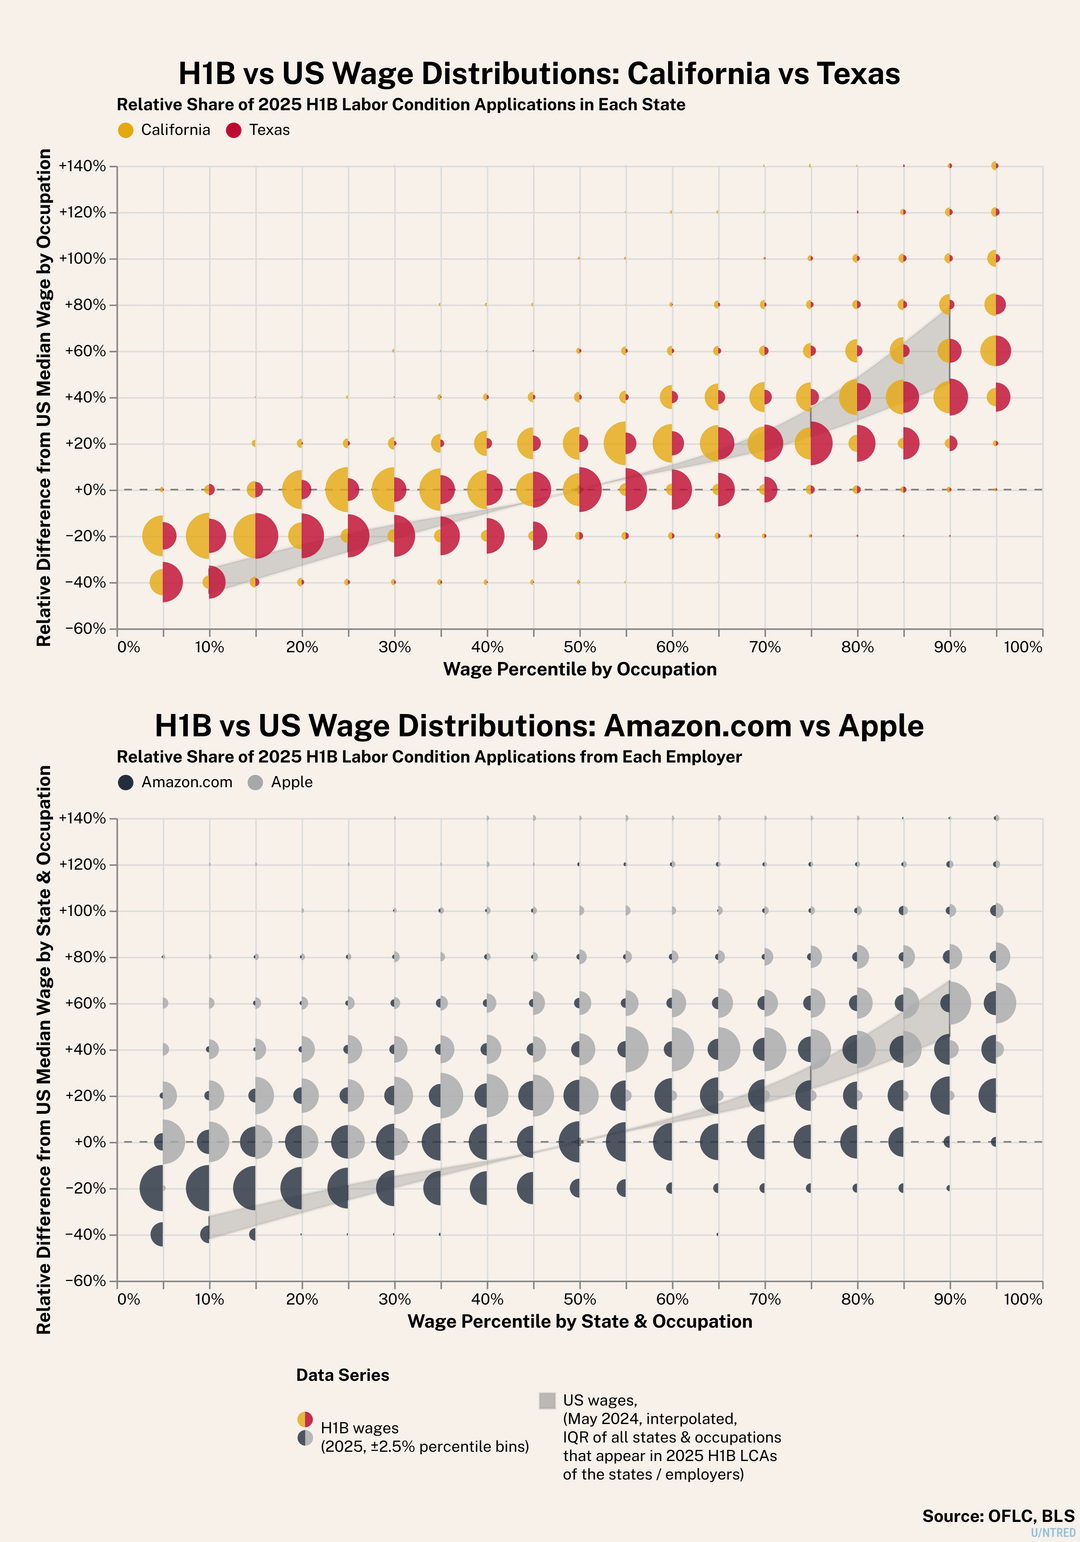
- Both H1B and US wages are grouped by state & occupation (SOC code) and compared against the US median wage of that state & occupation from BLS wage statistics.
- 10/25/75/90-th percentiles of US wages are plotted as interquartile range bands (25%-75%) of all the state-occupation pairs found in H1B data of a specific chart.
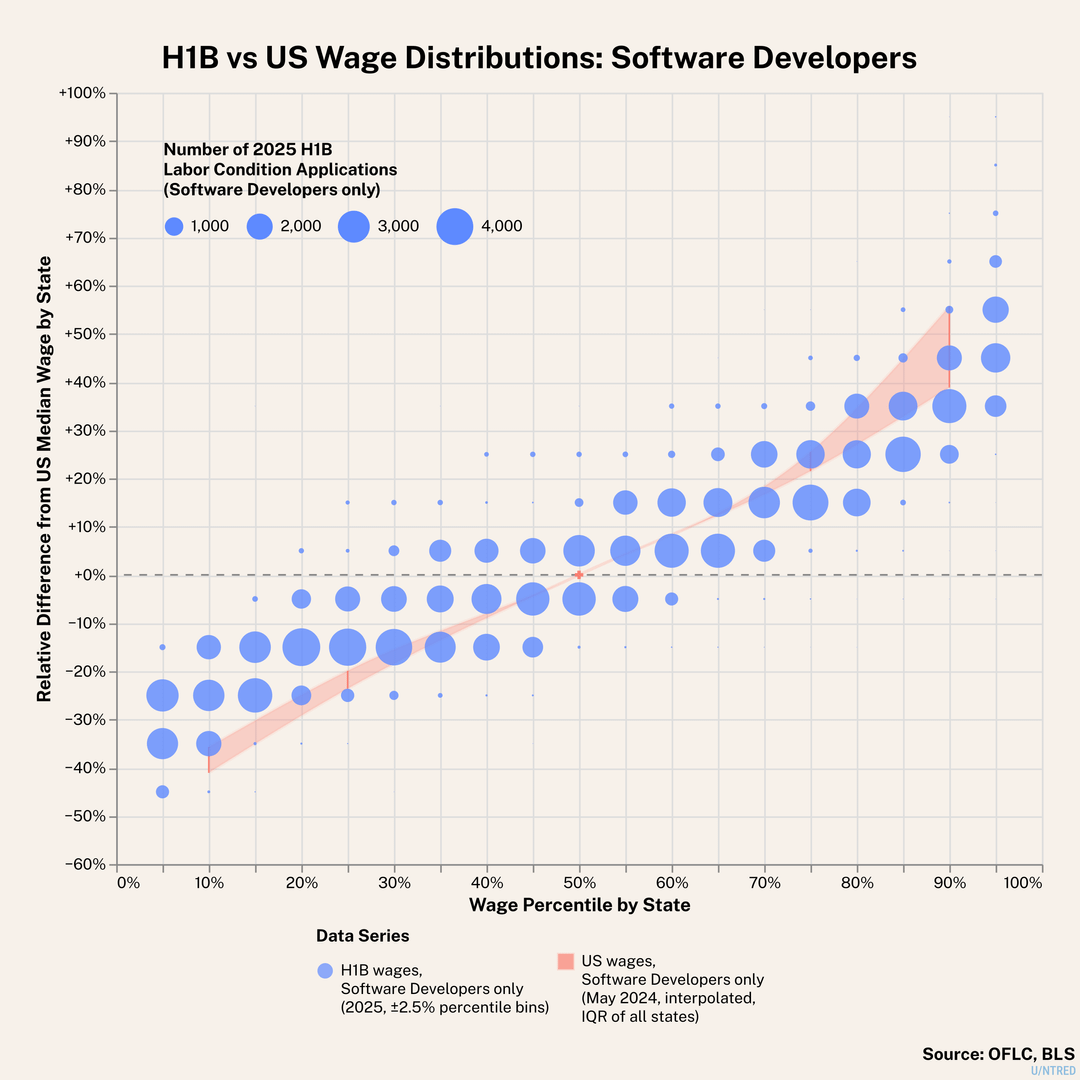
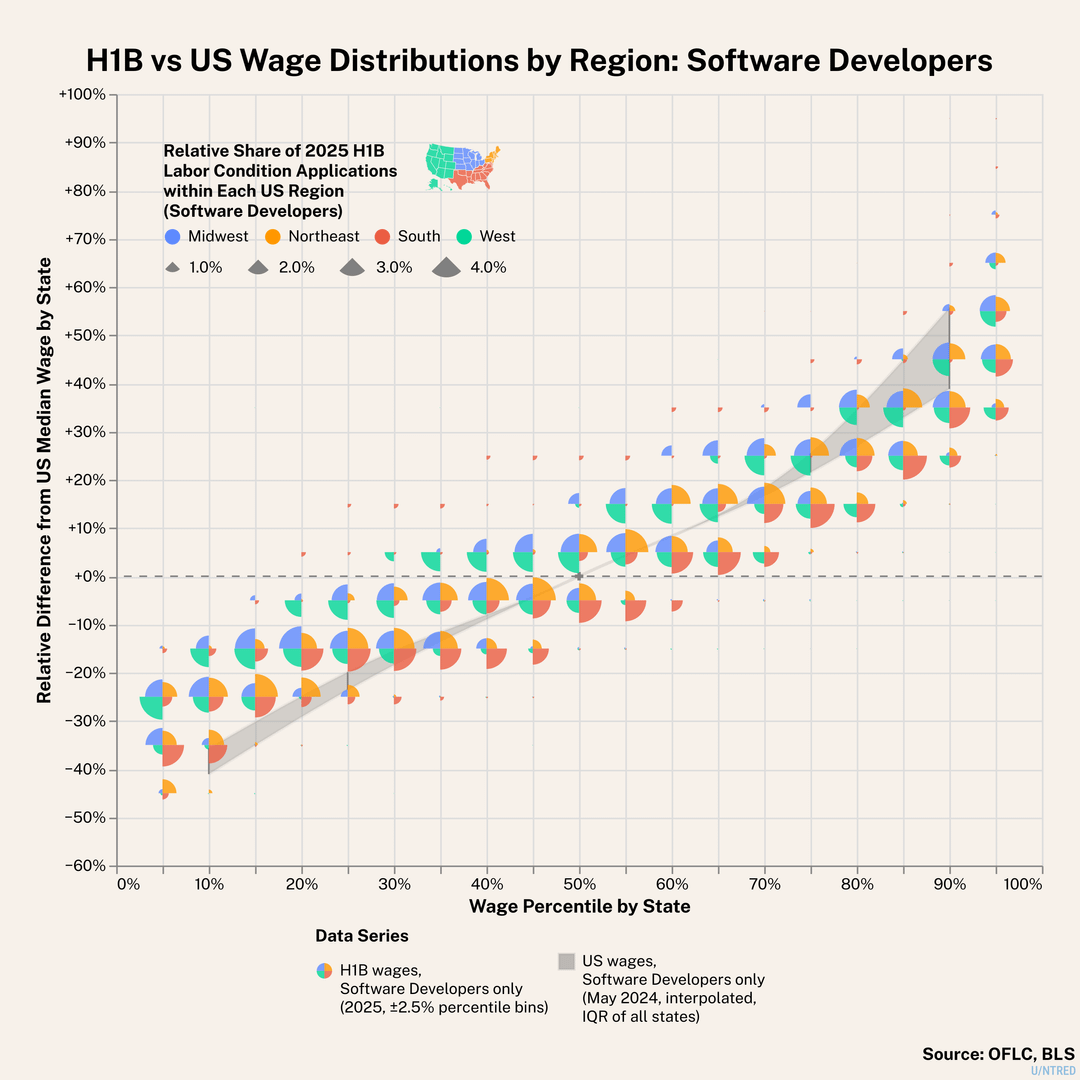
- Software Developer (SOC 15-1252) has the most H1B LCAs, accounting for 32% of all entries.
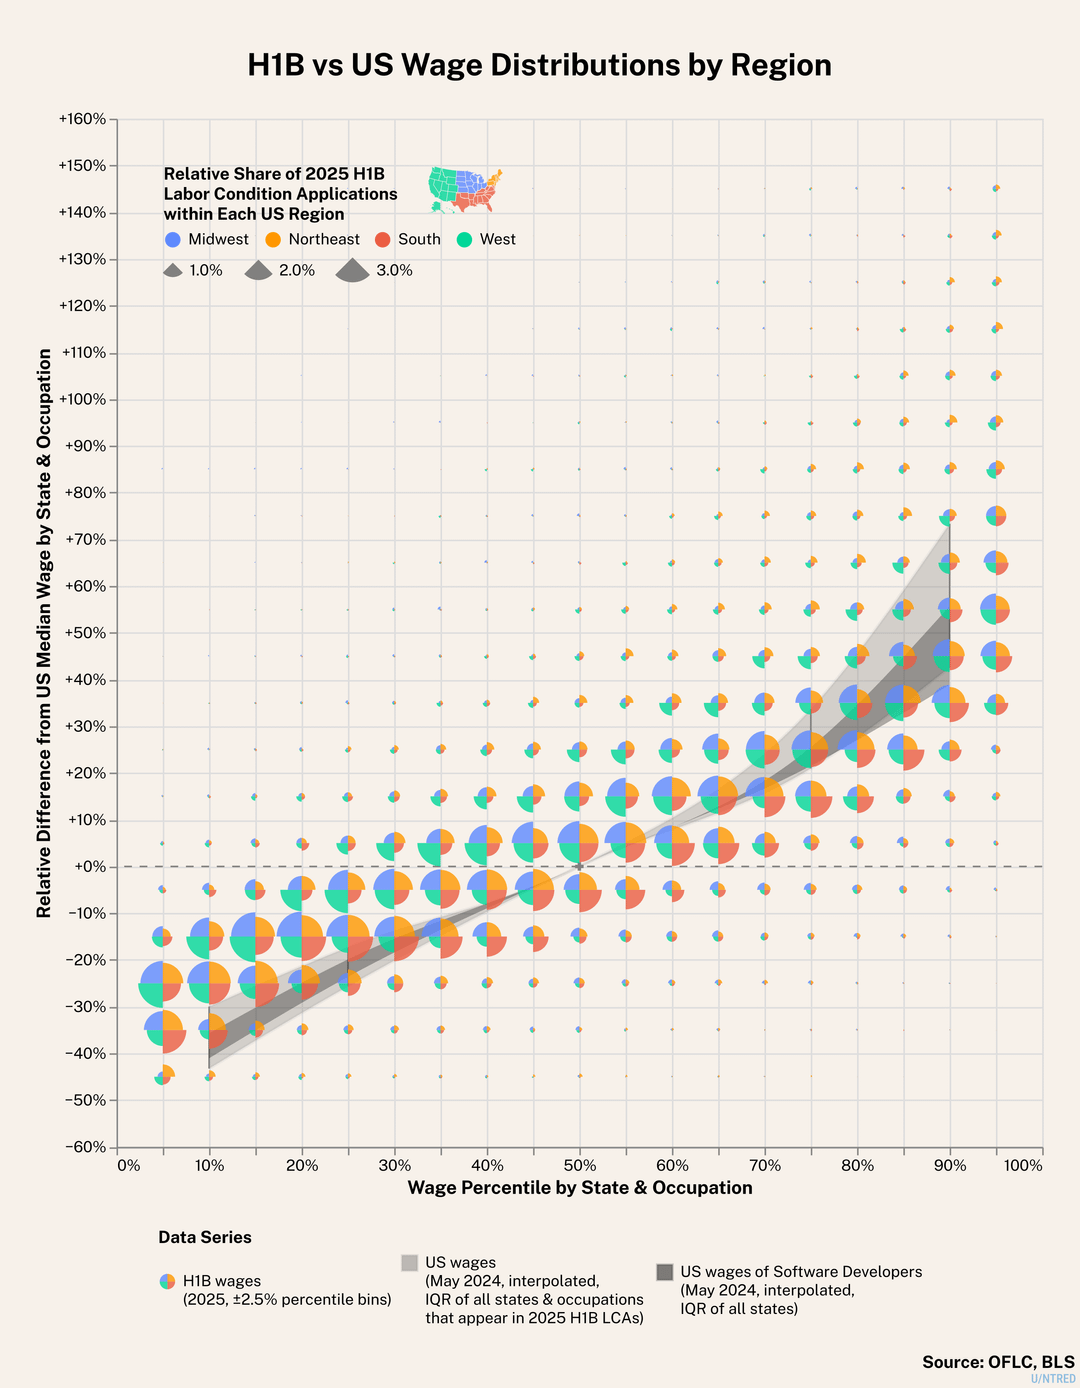
- The regional charts are based on US Census Bureau's 4-region definition.
- Only certified LCAs for H1B positions are counted. LCA is not an H1B petition but is a prerequisite. The numbers of LCAs are different from H1B petitions or approvals.
- About 32% of the H1B LCAs provide a range of wages ("from" / "to"), among which >97% have "to" less than 2x "from". The midpoint is used as the wage for those positions. For all other cases where "to" is missing or larger than 2x "from", the lower bound "from" is used.
- H1B wages not in unit of year are normalized to annual numbers assuming 2080 hours per year (52 40-hour weeks). This affects <7% of all H1B LCA data.
- Data points above or below the range of the graph may be cropped, including the half percentile ranges at 0% and 100%.
Tools: Python / Vega-Altair, Inkscape
by ntred