
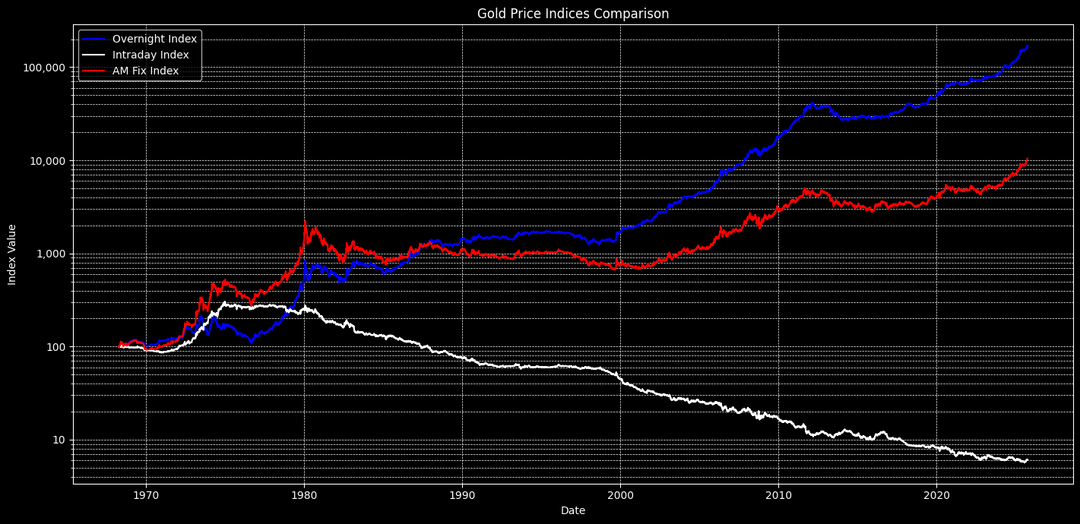
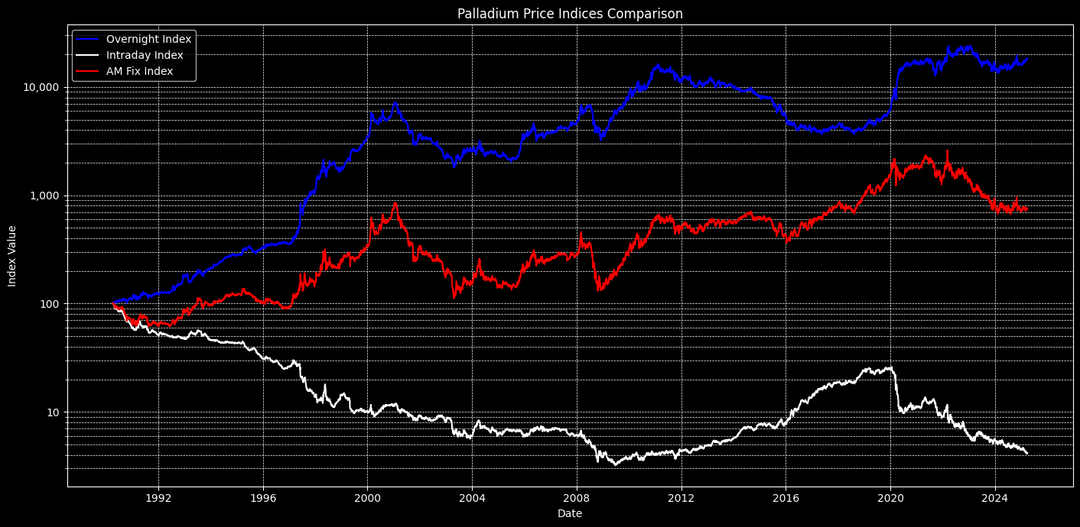
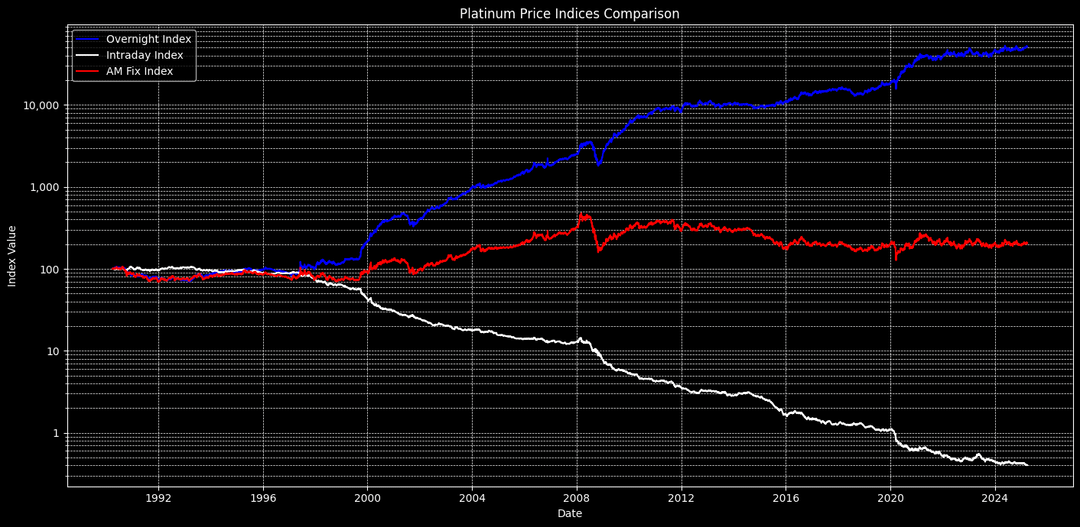
I split gold, platinum, and palladium prices into two strategies: buying at morning fix and selling at afternoon fix (intraday/Western hours) vs. buying at afternoon fix and selling next morning (overnight/Eastern hours).
The results are pretty shocking:
Gold (1968-2025):
- Overnight strategy: +171,205.59% (13.83% CAGR)
- Intraday strategy: -93.88% (-4.73% CAGR)
- Buy & hold: +10,383.91% (8.43% CAGR)
Platinum (1990-2025):
- Overnight: +84,293.88% (20.86% CAGR)
- Intraday: -99.6% 🤯
If you'd only held the metals during London/NY hours for the past 50 years, you'd have basically lost everything. All the appreciation happened during Asian trading hours.
Full analysis and code: https://github.com/Robin-Haupt-1/lbma-east-west-divergence
I've seen this analysis somewhere else before for gold, but not the other metals. As far as i'm aware this is the first public analysis of all LBMA metals that have AM and PM fixes.
by robinhaupt
5 Comments
Data source: Official LBMA website (scraped)
Tool used for visualization: matplotlib
see codebase for details
I’ve seen this analysis somewhere else before for gold, but not the other metals. As far as i’m aware this is the first public analysis of all LBMA metals that have AM and PM fixes.
Thanks! This is very cool! I will never sleep again!
Sorry there’s some mistakes in the percentage calculations in this post. I will fix them.
Cross post that to /r/investing, see what they say 😉
Edit typo
It would be nice to see this showing the nightly returns instead of the price.