
You can view the live map here: https://voiceandsilence.com/
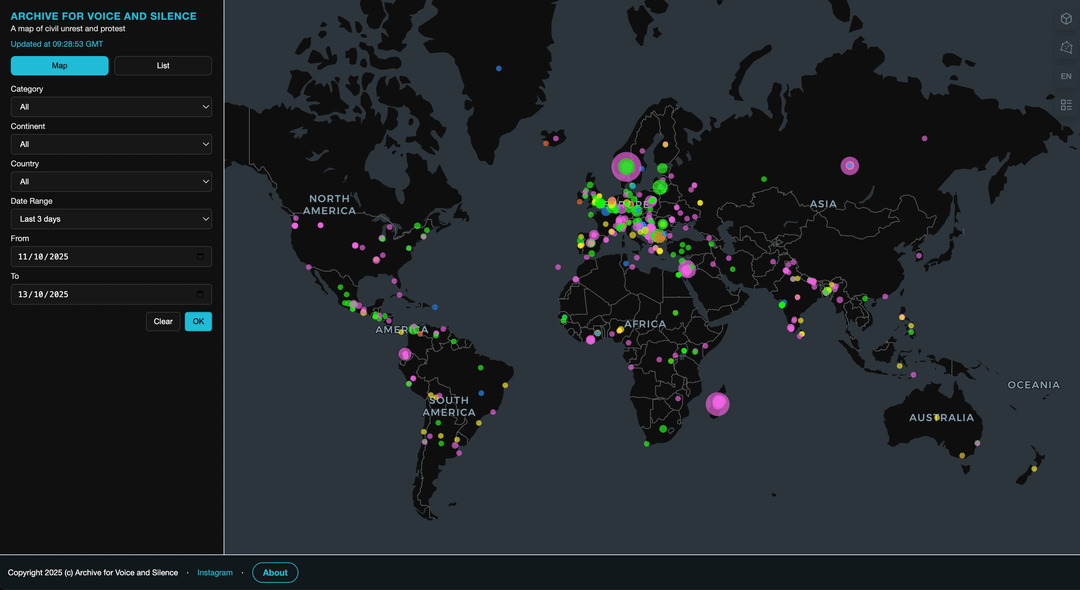
I've created a personal project called Archive for Voice and Silence, a website that uses AI to track and map protests and activist movements around the world. The goal is to provide a clean, visual representation of these events for researchers, journalists, and anyone interested in social movements.
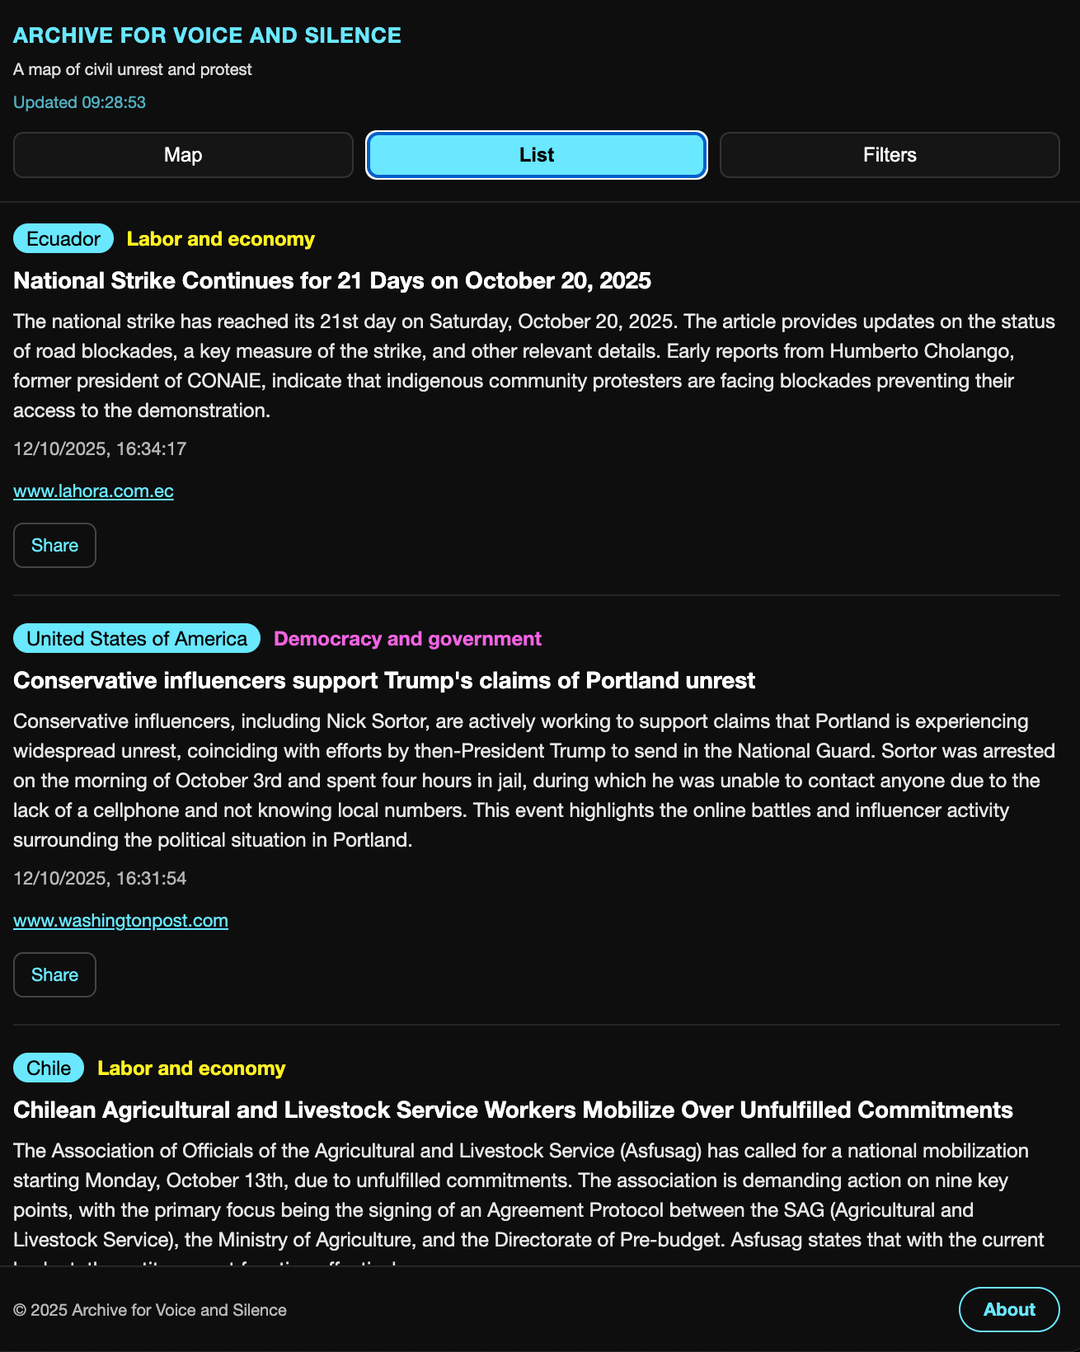
The live map on the site is a data visualization that shows the relevance and geolocation of these events over time. Each event can be shared individually, allowing users to quickly point to specific instances of protest. Users can filter the data by unrest theme, location, and date range, and they can also download the data as daily CSV files on the Github repo, for their own analysis.
- Tool: The website is built using a custom Python backend with a JavaScript frontend for the map visualization. It uses an AI-powered API from my startup, Thembi, to filter and process the raw data.
- Data Source: Data is collected and filtered in real-time from a (big) range of publicly available sources.
I'm open to collaboration, and any other feedback. I want this to be a useful resource for the community.
by de-sacco
2 Comments
Looks like Europe is very vocal about the problems in the world. Well done.
As long as no violence occurs I fully support your right to protest but not nessassary agree with it (whatever it is)
This is an interesting idea, but from the distribution of points on the map it’s pretty obvious that the data is woefully incomplete, to the extent of conveying a completely inaccurate picture of where protests are happening globally.
There are protests almost every day, in almost every mid-sized US city, often even in small towns, for and against an unimaginable breadth of issues. There should probably be thousands of dots in the US alone for any 3-day-period.
In light of this, the name “Archive for Voice and Silence” seems rather inappropriate. An absence of points on your map doesn’t indicate “silence”, it indicates that your data is incomplete.