
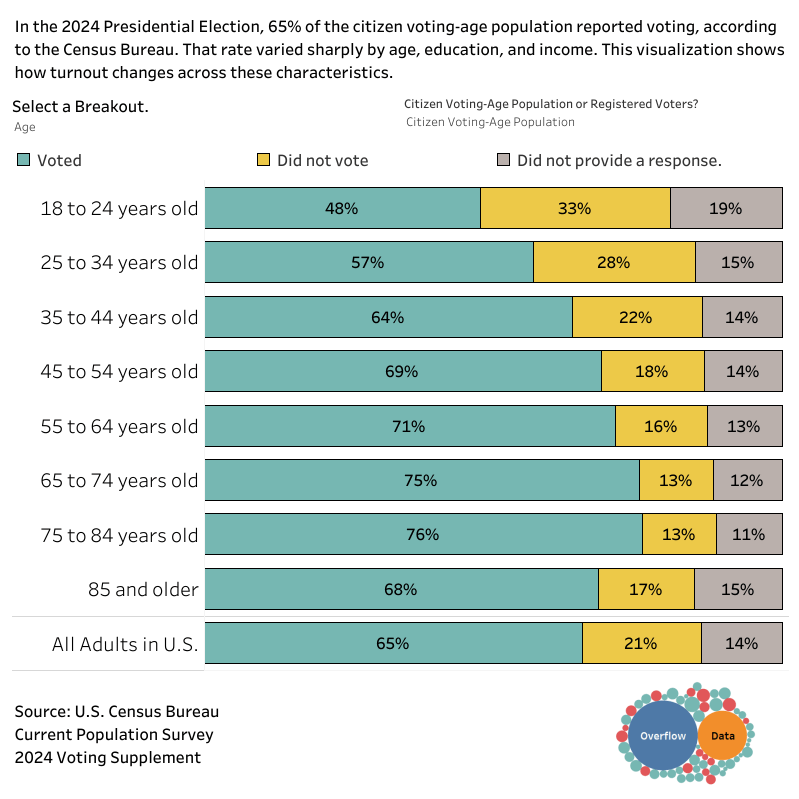
Over the last few weeks, I have been gathering feedback on this visualization's static images. Here is a link to the interactive version that will let you explore a number of different characteristics.
This interactive Tableau visualization lets you explore how these characteristics are related to voting behavior, using data from the Census Bureau's Current Population Survey’s 2024 Voting and Registration Supplement.
by OverflowDs